Fig. 11
Download original image
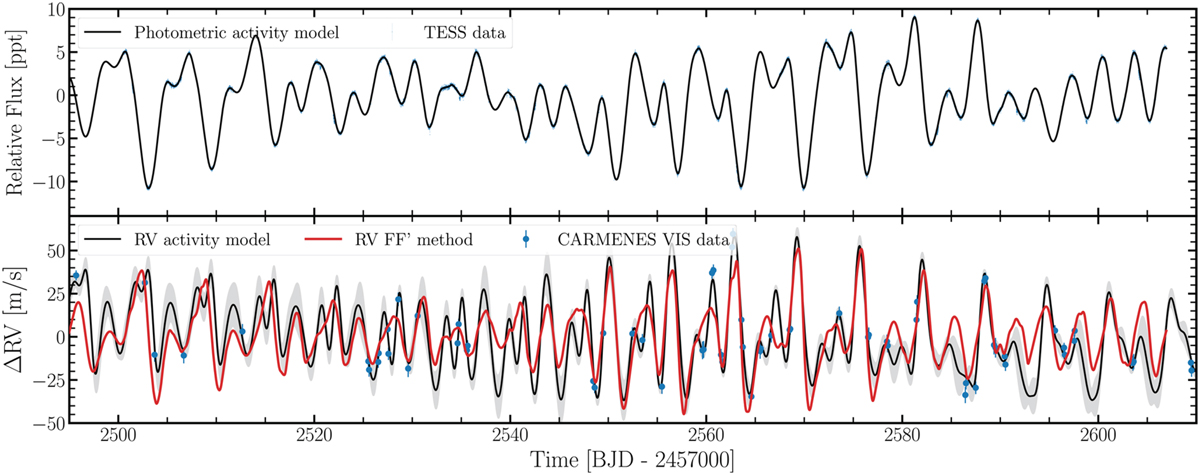
Comparison between photometric and RV stellar activity. Top panel: TESS light curve of HD 63433 contemporaneously with the RV of CARMENES data. The blue dots are the PDCSAP flux, and the black line indicates the best activity model. Bottom panel: CARMENES RV VIS data shown with blue dots. The black line shows the GP activity model with its 1σ confidence level (grey shadow). The solid red line depicts the RV model predicted from the TESS light curve using FF′ method.
Current usage metrics show cumulative count of Article Views (full-text article views including HTML views, PDF and ePub downloads, according to the available data) and Abstracts Views on Vision4Press platform.
Data correspond to usage on the plateform after 2015. The current usage metrics is available 48-96 hours after online publication and is updated daily on week days.
Initial download of the metrics may take a while.