Open Access
Fig. 5
Download original image
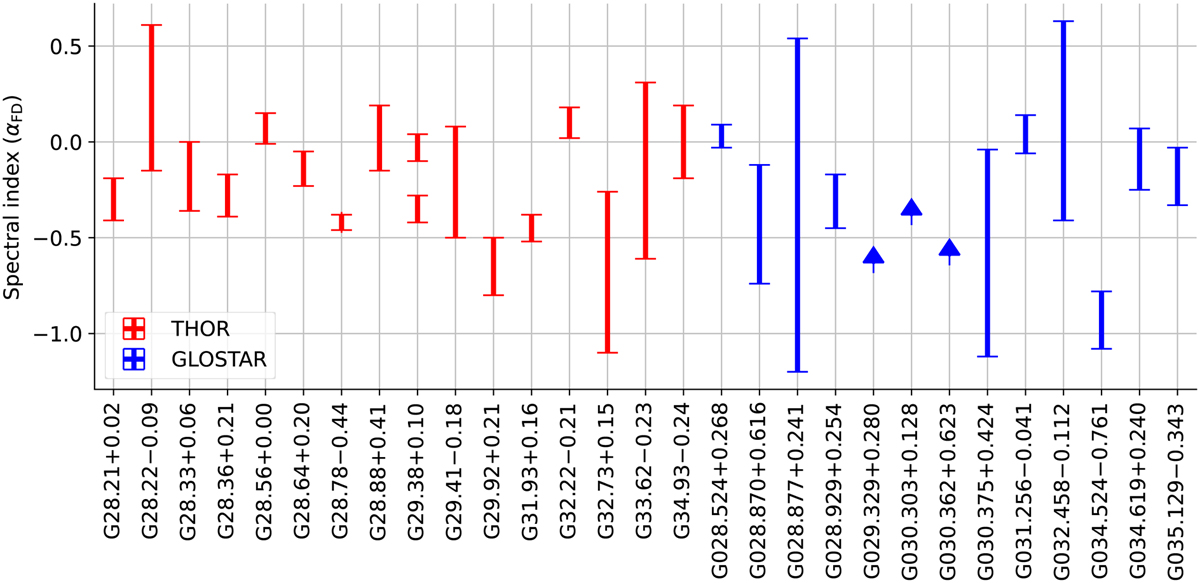
Flux density spectral indices (αFD) of the candidate SNRs being studied in this work. Candidates with lower limits are represented by upward arrows. Since G29.38+0.10 has a spectral break, both the spectral indices are shown.
Current usage metrics show cumulative count of Article Views (full-text article views including HTML views, PDF and ePub downloads, according to the available data) and Abstracts Views on Vision4Press platform.
Data correspond to usage on the plateform after 2015. The current usage metrics is available 48-96 hours after online publication and is updated daily on week days.
Initial download of the metrics may take a while.