Fig. 4
Download original image
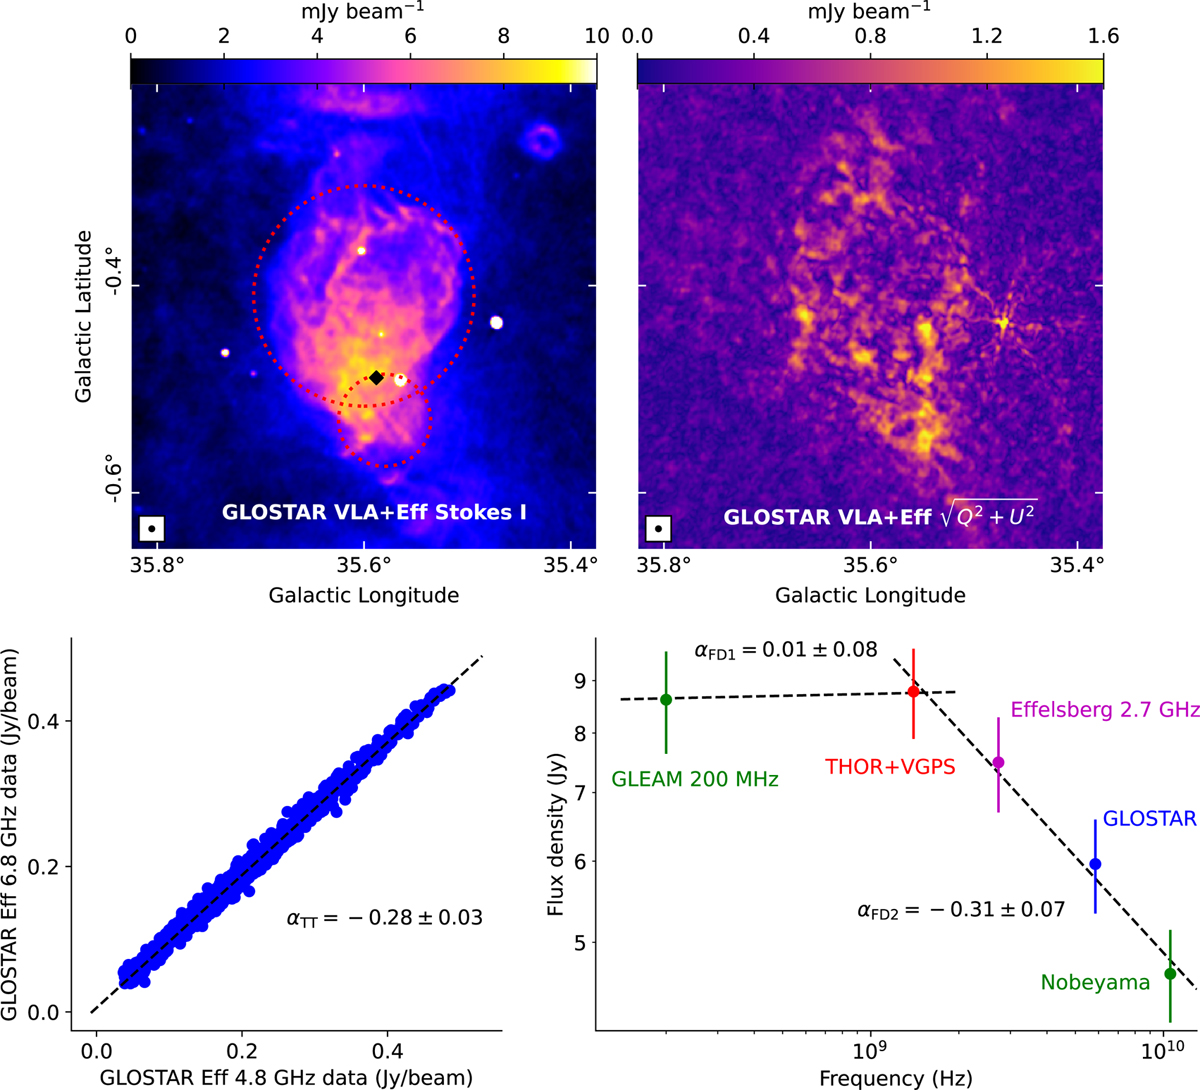
SNR G35.6-0.4: the top left and right panels show the GLOSTAR combination images of total and linearly polarized intensity. The red dotted circles represent the two shell-like structures identified at 610 MHz by Paredes et al. (2014), while the black diamond marks the position of the recombination line discovered by Lockman (1989). The TT-plot from GLOSTAR-Effelsberg images and the flux density spectrum are presented in the bottom left and right panels respectively.
Current usage metrics show cumulative count of Article Views (full-text article views including HTML views, PDF and ePub downloads, according to the available data) and Abstracts Views on Vision4Press platform.
Data correspond to usage on the plateform after 2015. The current usage metrics is available 48-96 hours after online publication and is updated daily on week days.
Initial download of the metrics may take a while.