Open Access
Fig. B.1
Download original image
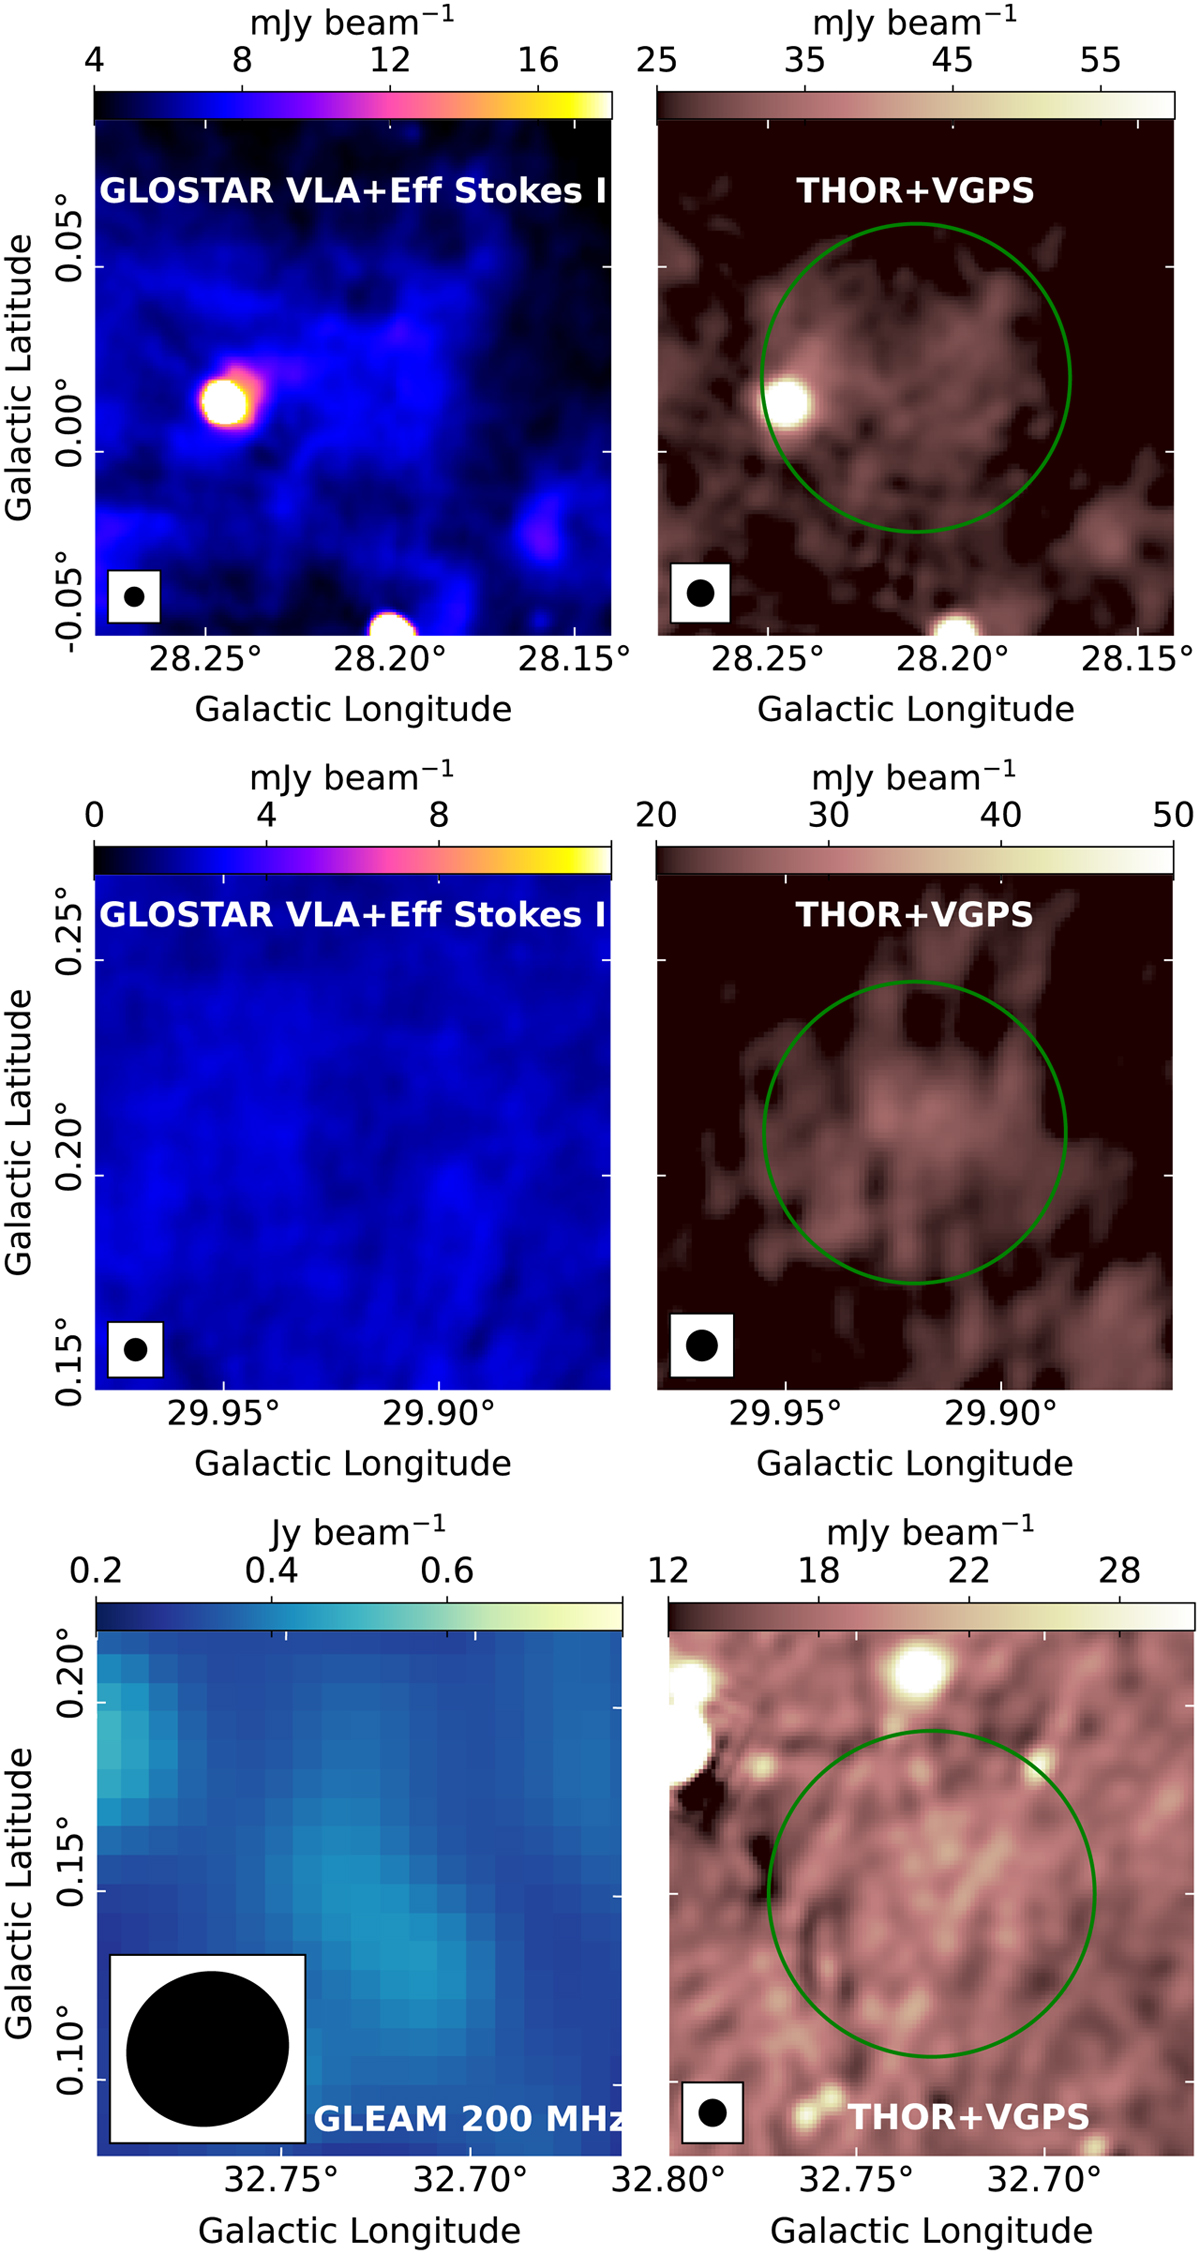
Images of three SNR candidates from THOR: G28.21+0.02 (top panels), G29.92+0.21 (middle panels) and G32.73+0.15 (bottom panels). The diffuse emission from G28.21+0.02 overlaps with the bright H II region at l~28.25°, b~0.01°. G29.92+0.21 and G32.73+0.15 are not detected in the GLOSTAR combination images.
Current usage metrics show cumulative count of Article Views (full-text article views including HTML views, PDF and ePub downloads, according to the available data) and Abstracts Views on Vision4Press platform.
Data correspond to usage on the plateform after 2015. The current usage metrics is available 48-96 hours after online publication and is updated daily on week days.
Initial download of the metrics may take a while.