Fig. 1
Download original image
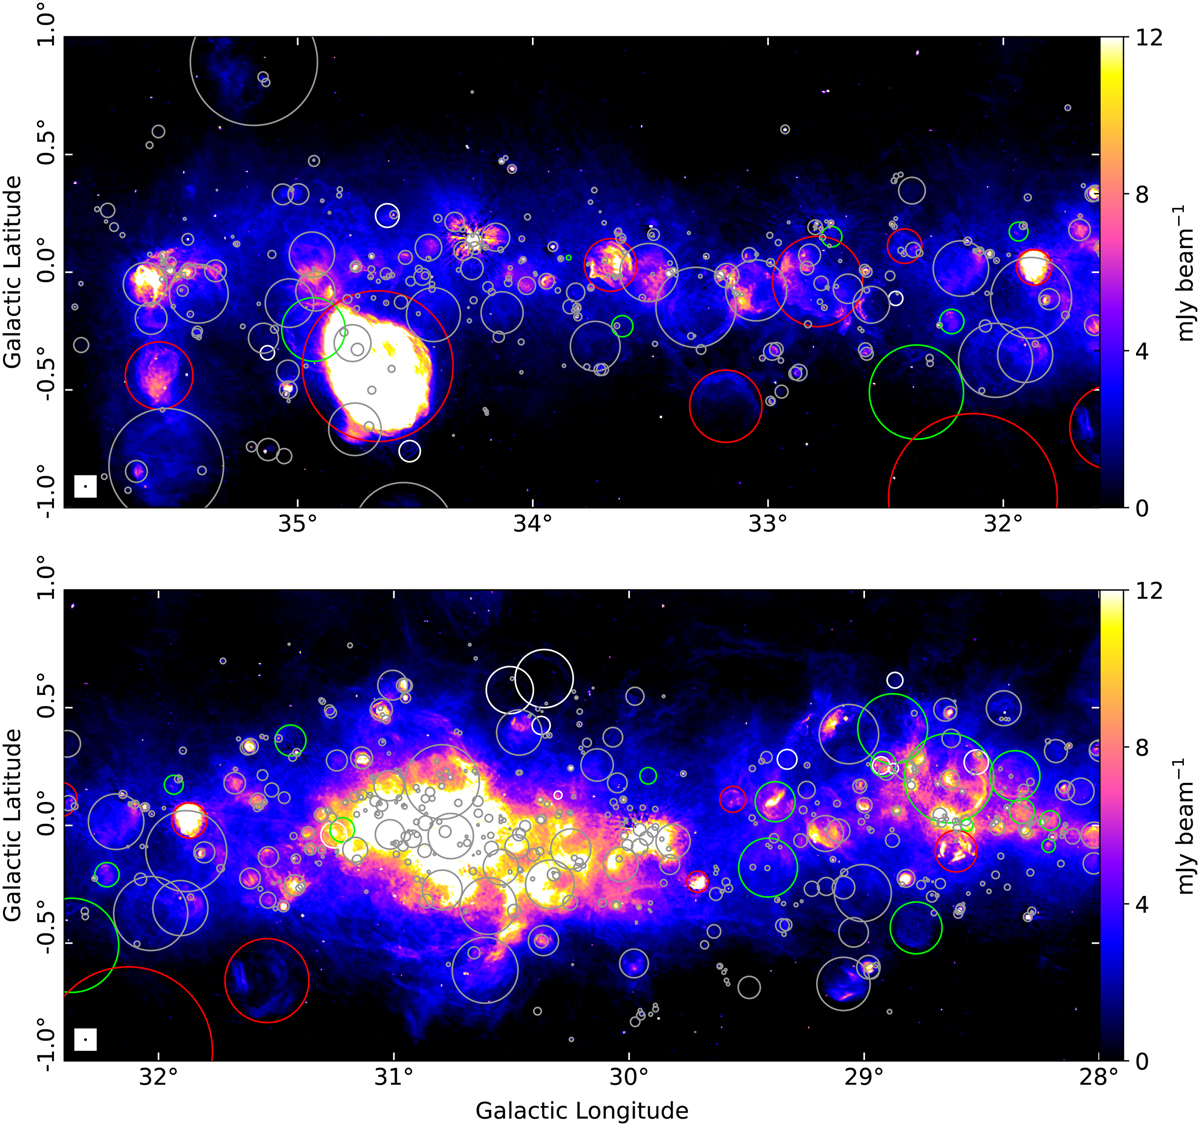
GLOSTAR combination (VLA-D+Effelsberg; Brunthaler et al. 2021) image of the region of interest of this study, without the restoration using Urumqi maps (see text for details). The red, green, and white circles mark the known SNRs (Ferrand & Safi-Harb 2012; Green 2019), the THOR SNR candidates (from Anderson et al. 2017), and the GLOSTAR SNR candidates (from Dokara et al. 2021), respectively. The much more numerous H II regions, from the WISE catalog (Anderson et al. 2014) and the GLOSTAR VLA D-configuration catalog (Medina et al. 2019), are marked using grey circles.
Current usage metrics show cumulative count of Article Views (full-text article views including HTML views, PDF and ePub downloads, according to the available data) and Abstracts Views on Vision4Press platform.
Data correspond to usage on the plateform after 2015. The current usage metrics is available 48-96 hours after online publication and is updated daily on week days.
Initial download of the metrics may take a while.