Fig. 6
Download original image
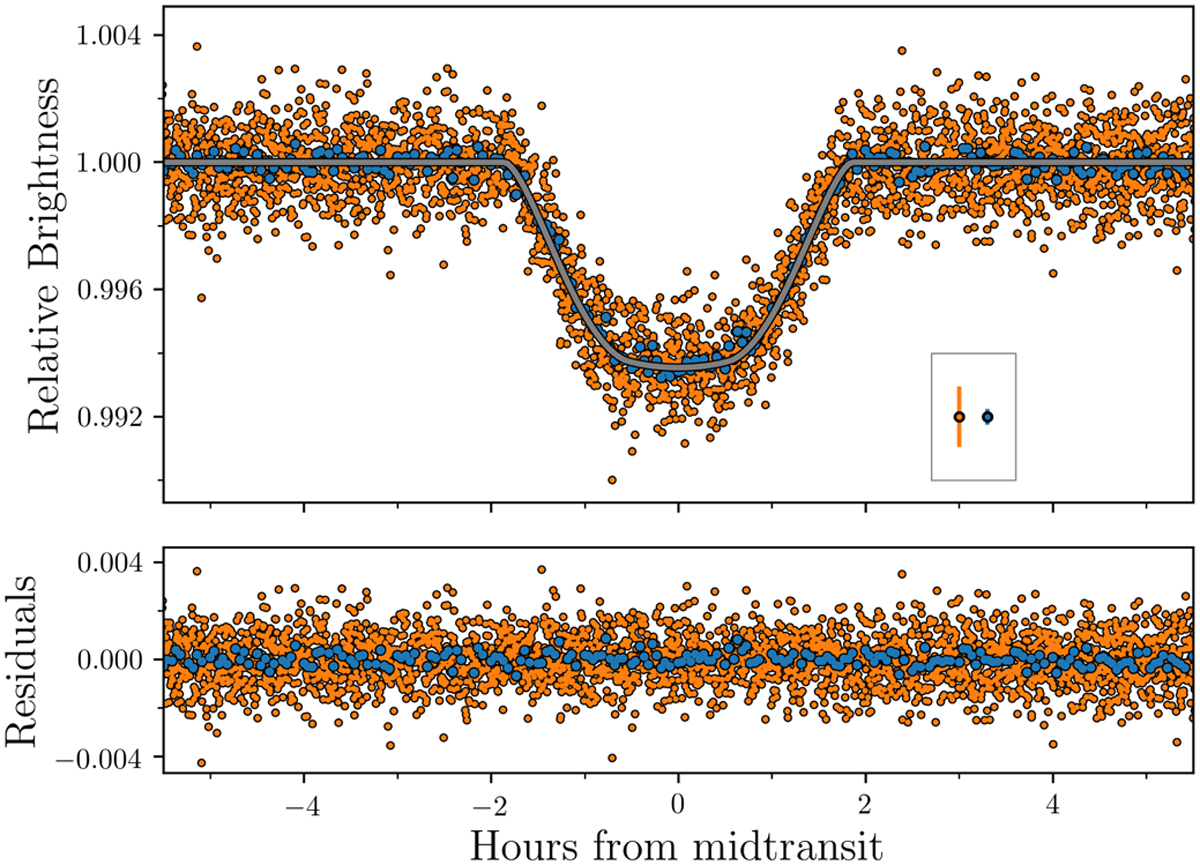
TESS transits of TOI-640 b. TESS photometry phase folded to the period from Table 2 and centred on the transit. As in Fig. A.1, blue and orange points are the 30 and 2 min cadence data, respectively. The points with error bars in the box are not data, but illustrate the typical errors for the data. The data shown here have been detrended with the GP (white line in Fig. A.1). The grey curve is the best-fitting light curve.
Current usage metrics show cumulative count of Article Views (full-text article views including HTML views, PDF and ePub downloads, according to the available data) and Abstracts Views on Vision4Press platform.
Data correspond to usage on the plateform after 2015. The current usage metrics is available 48-96 hours after online publication and is updated daily on week days.
Initial download of the metrics may take a while.