Fig. 4
Download original image
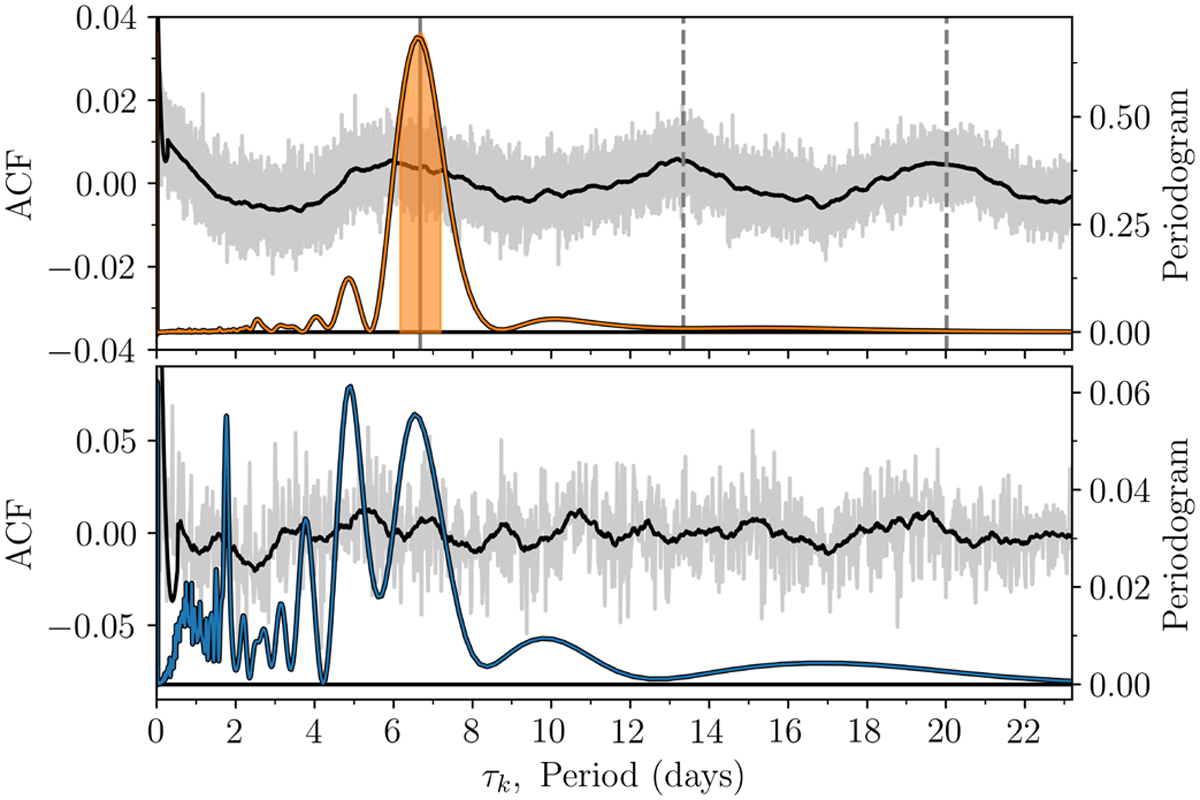
Autocorrelation function. The ACFs are shown as the grey curves with a smoothed version in black. The (coloured) periodogram is calculated from the smoothed ACF. The y-axis on the left (right) is for the ACF (periodogram). Top: the 2 min cadence ACF with the corresponding periodogram. The vertical grey line denotes the measured rotation period, and the dashed lines are integer values of this value. Shown as the shaded area is the confidence interval for the rotation period. Bottom: the 30 min cadence ACF.
Current usage metrics show cumulative count of Article Views (full-text article views including HTML views, PDF and ePub downloads, according to the available data) and Abstracts Views on Vision4Press platform.
Data correspond to usage on the plateform after 2015. The current usage metrics is available 48-96 hours after online publication and is updated daily on week days.
Initial download of the metrics may take a while.