Fig. 1
Download original image
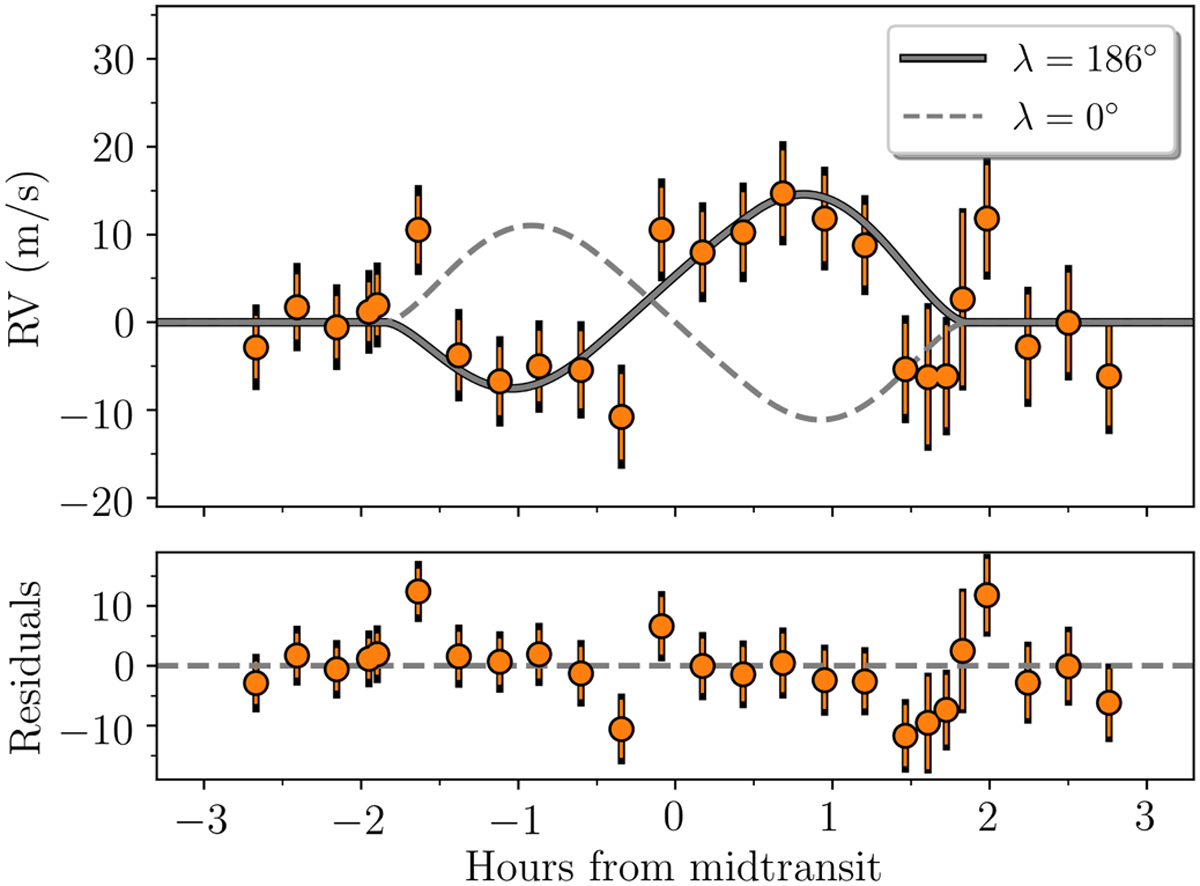
Rossiter-McLaughlin effect as seen from HARPS RVs centred around the mid-transit time after subtracting the Keplerian motion induced by the planet. The grey line shows the RM effect with the best-fitting (retrograde) model as the solid line and an aligned model as the dashed line. The error bars include the jitter term from our MCMC added in quadrature, shown as the black extension.
Current usage metrics show cumulative count of Article Views (full-text article views including HTML views, PDF and ePub downloads, according to the available data) and Abstracts Views on Vision4Press platform.
Data correspond to usage on the plateform after 2015. The current usage metrics is available 48-96 hours after online publication and is updated daily on week days.
Initial download of the metrics may take a while.