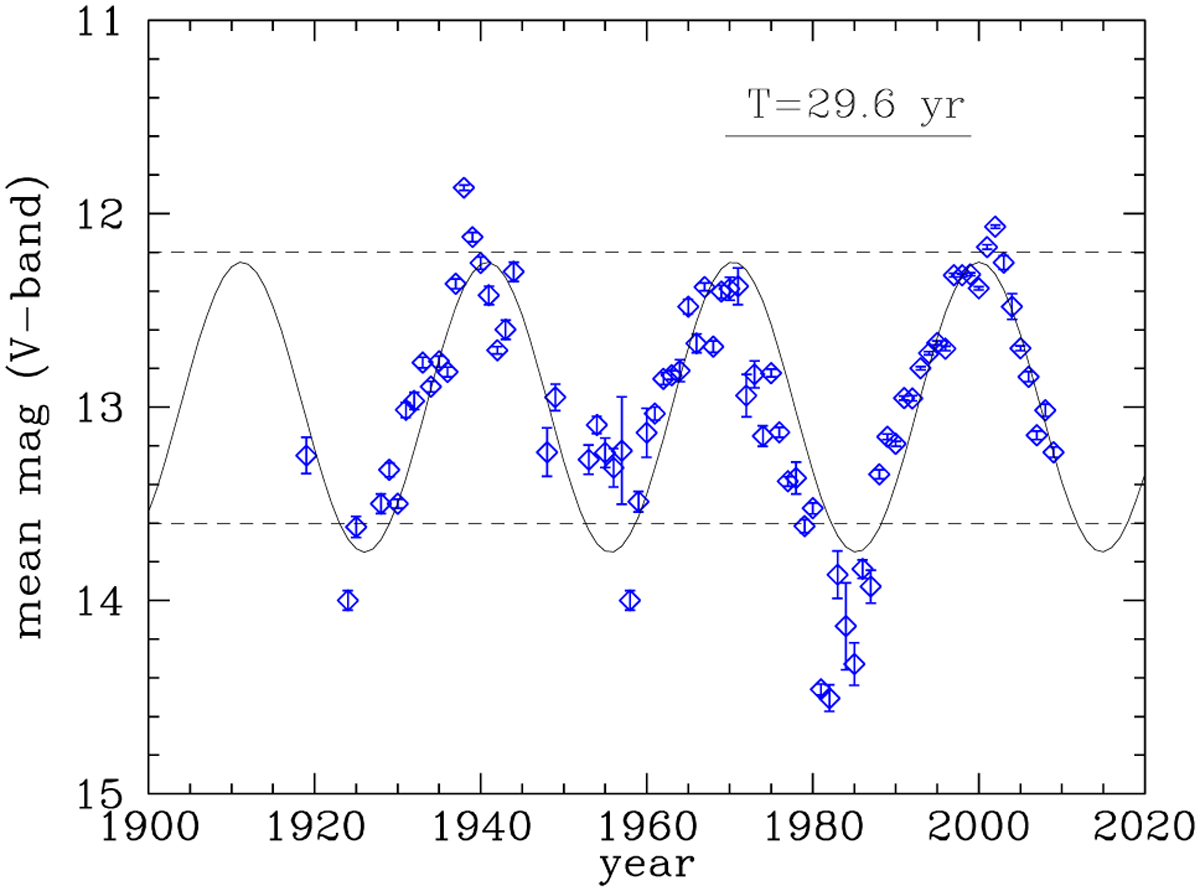
Fig. 2
Download original image
Secular light curve of T CrA with the photometry collected from the AAVSO archive. Each point is the mean value for each year; the error bar is the standard deviation of the mean. The horizontal dashed lines show the ΔV-mag variation. The period of the light curve that measured as the mean between the difference of the first and third maxima and minima is labeled.
Current usage metrics show cumulative count of Article Views (full-text article views including HTML views, PDF and ePub downloads, according to the available data) and Abstracts Views on Vision4Press platform.
Data correspond to usage on the plateform after 2015. The current usage metrics is available 48-96 hours after online publication and is updated daily on week days.
Initial download of the metrics may take a while.