Fig. B.1
Download original image
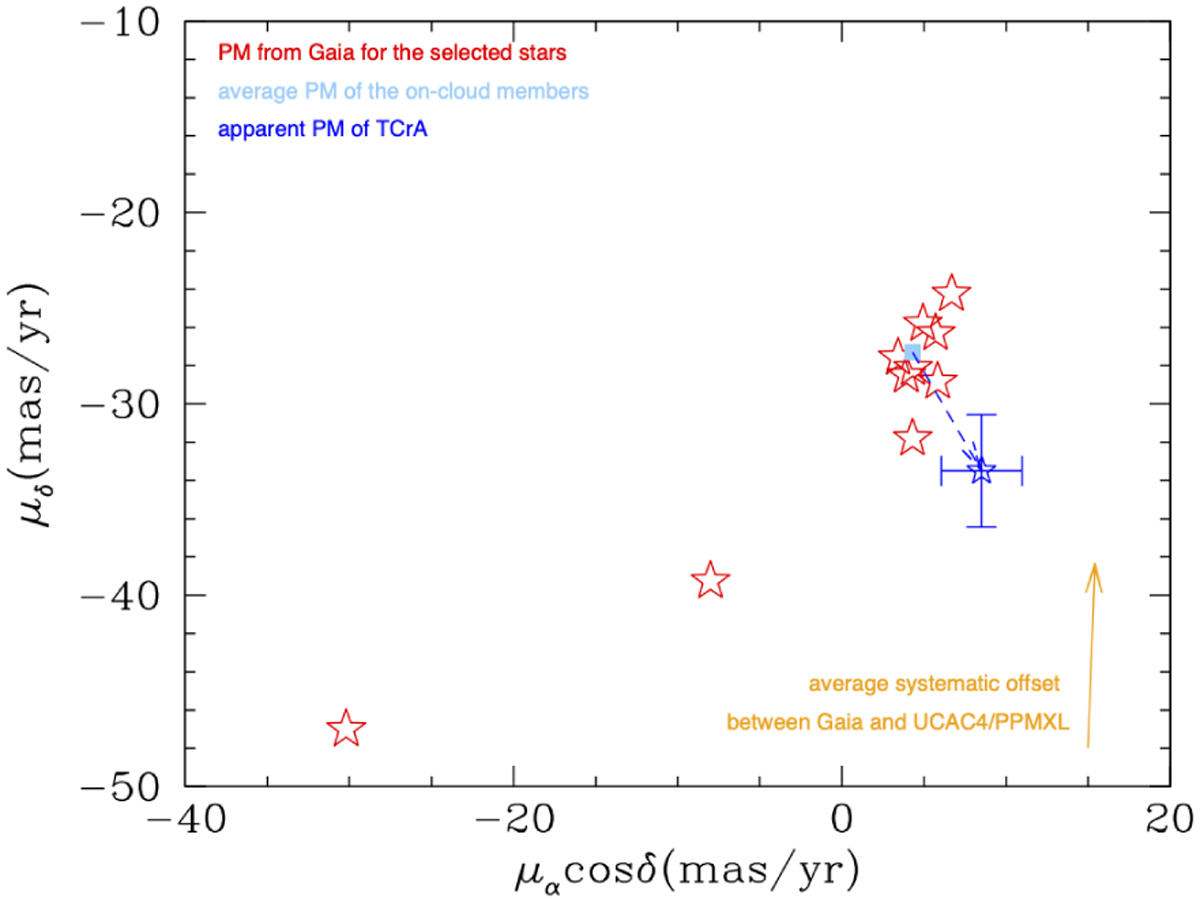
Proper motion of the ten stars reported in Table B.1. The cyan square represents the average proper motion for the on-cloud Coronet cluster obtained using Gaia DR2 data (Galli et al. 2020). The blue star is the calculated apparent proper motion of Τ CrA after correcting the long term proper motion for the systematic offset. In orange the direction of the systematic offset of the proper motion due to the different coordinate system.
Current usage metrics show cumulative count of Article Views (full-text article views including HTML views, PDF and ePub downloads, according to the available data) and Abstracts Views on Vision4Press platform.
Data correspond to usage on the plateform after 2015. The current usage metrics is available 48-96 hours after online publication and is updated daily on week days.
Initial download of the metrics may take a while.