Fig. 5
Download original image
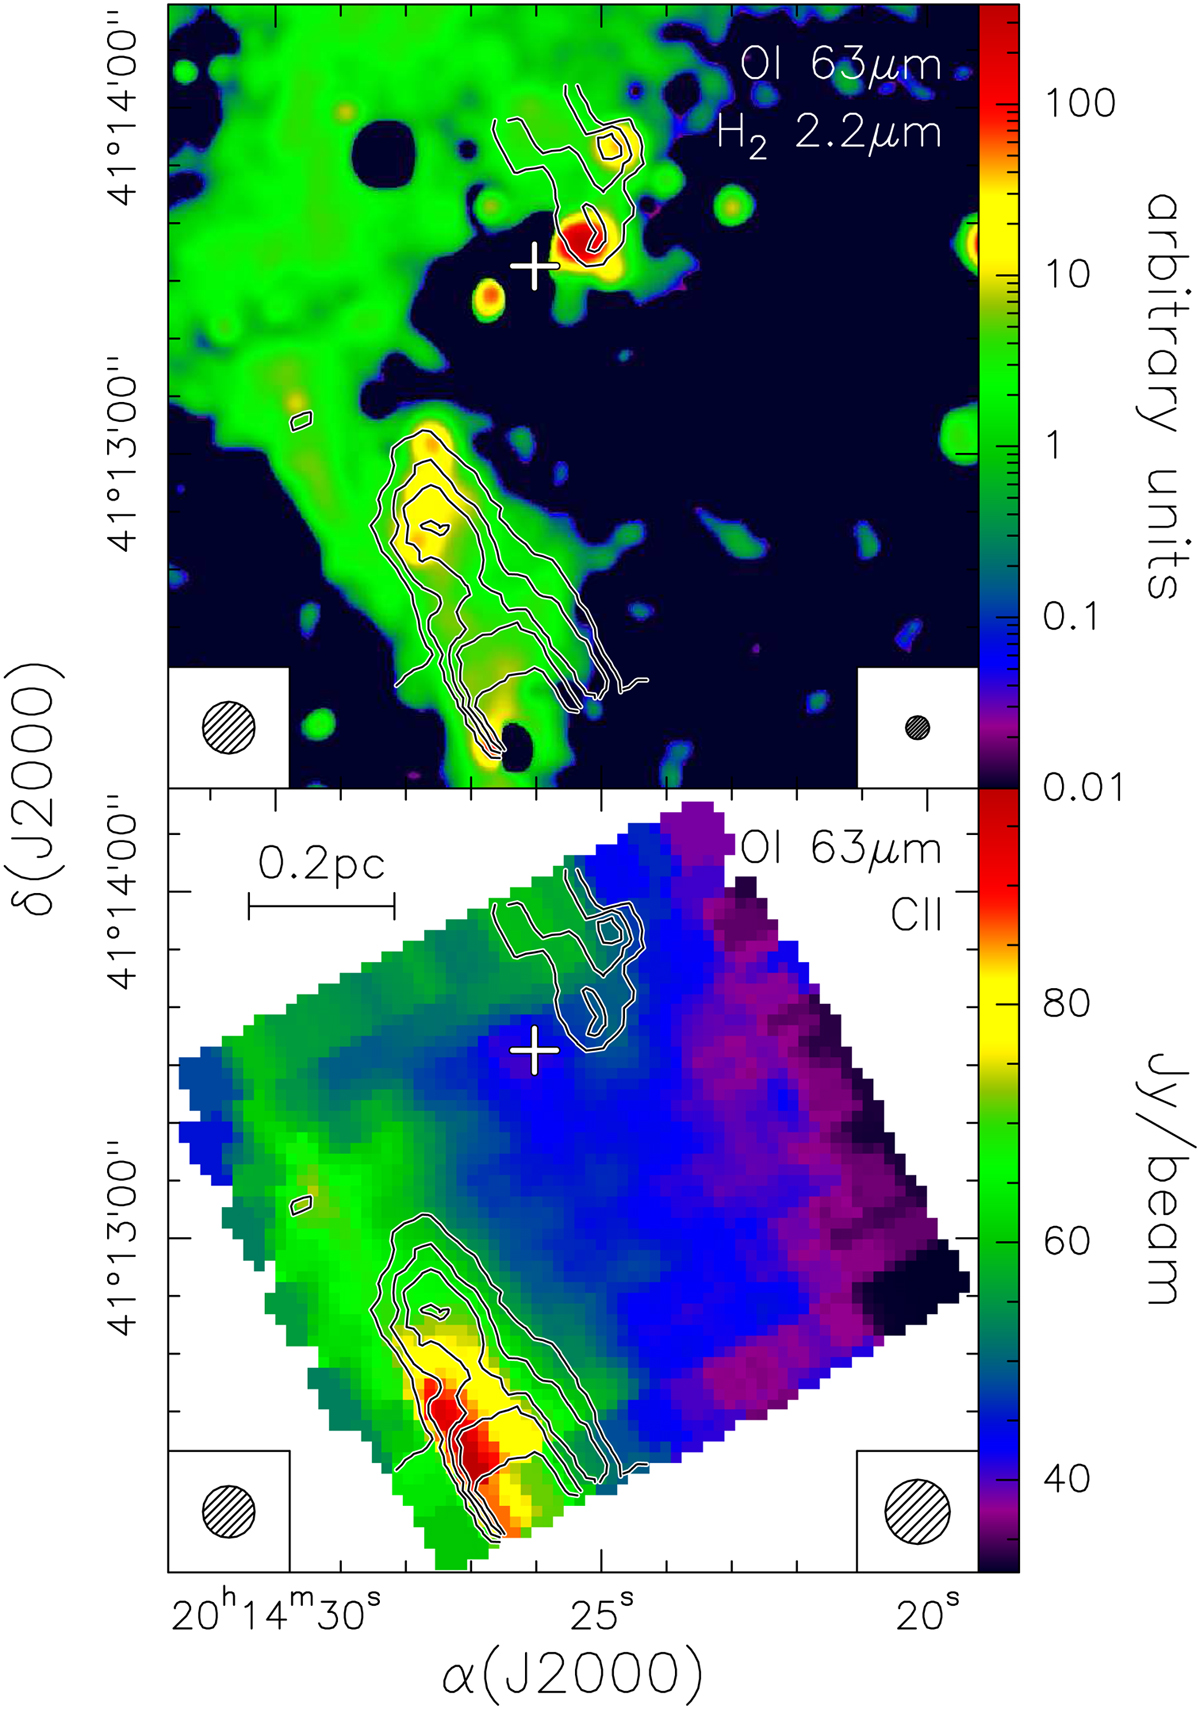
Contour map of the OI 63 μm line overlaid on the H2 2.12 μm line image from Cesaroni et al. (2005, top panel) and the CII line map (bottom panel). The circles in the bottom left are the HPBW of the OI map, while those in the bottom right are the HPBWs of the other lines. Contour levels range from 13.87 to 29.01 in steps of 3.78 Jy beam–1.
Current usage metrics show cumulative count of Article Views (full-text article views including HTML views, PDF and ePub downloads, according to the available data) and Abstracts Views on Vision4Press platform.
Data correspond to usage on the plateform after 2015. The current usage metrics is available 48-96 hours after online publication and is updated daily on week days.
Initial download of the metrics may take a while.