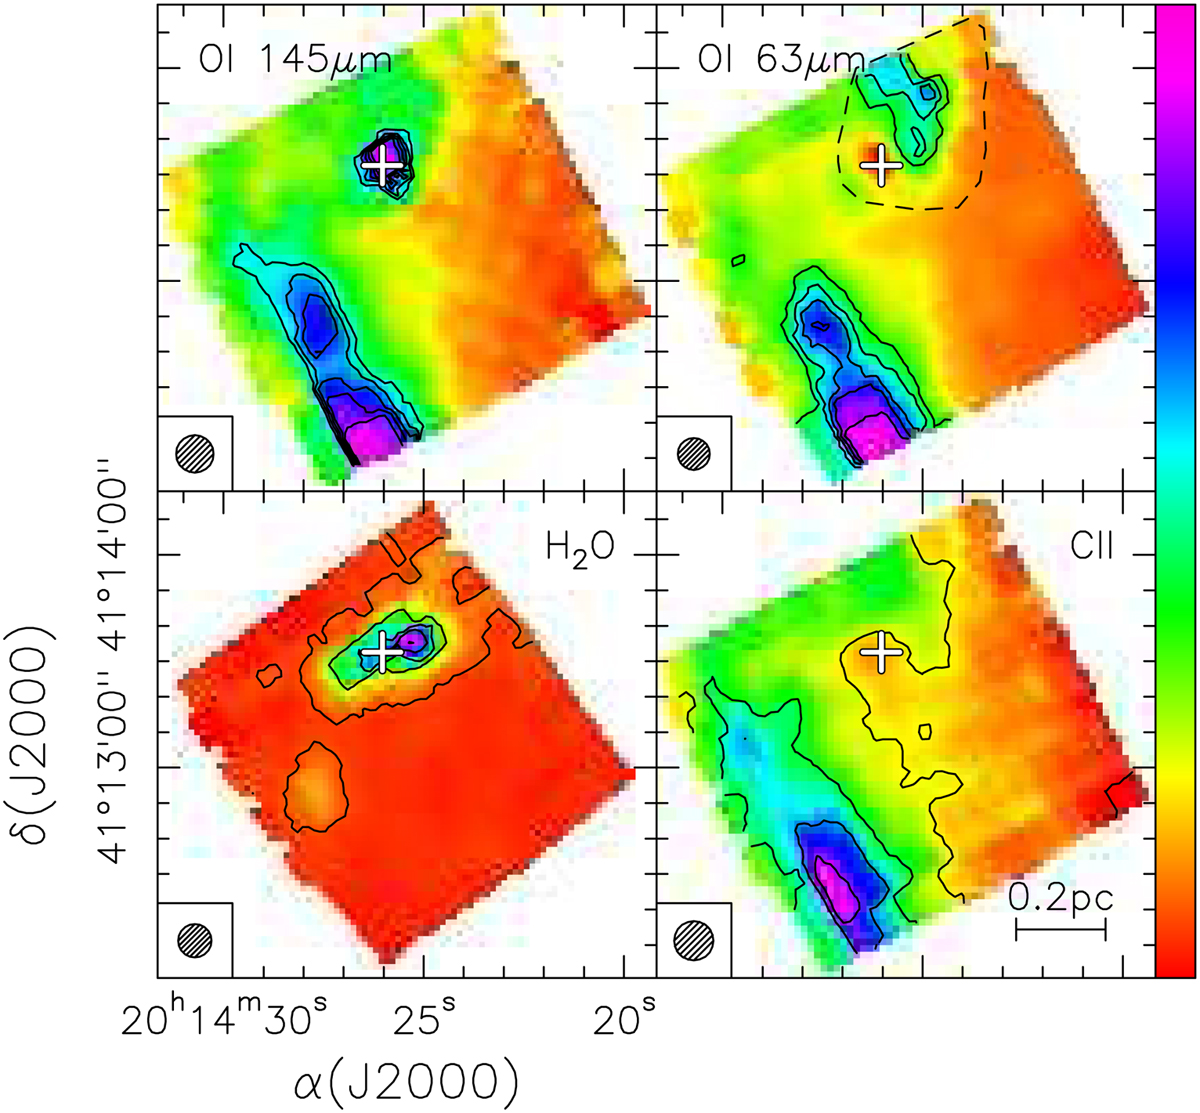
Fig. 4
Download original image
Same as Fig. 3, but for the H2O, OI, and CII lines. The dashed polygon outlines the region where an artefact is present in the OI 63 μm line emission. The minimum, maximum, and step for contour levels in units of Jybeam–1 are as follows (panel by panel, from top to bottom, and from left to right): 1.44, 2.27, 0.21; 13.87, 29.01, 3.78; 0.32, 9.27, 2.24; 32.27, 87.41, 13.78.
Current usage metrics show cumulative count of Article Views (full-text article views including HTML views, PDF and ePub downloads, according to the available data) and Abstracts Views on Vision4Press platform.
Data correspond to usage on the plateform after 2015. The current usage metrics is available 48-96 hours after online publication and is updated daily on week days.
Initial download of the metrics may take a while.