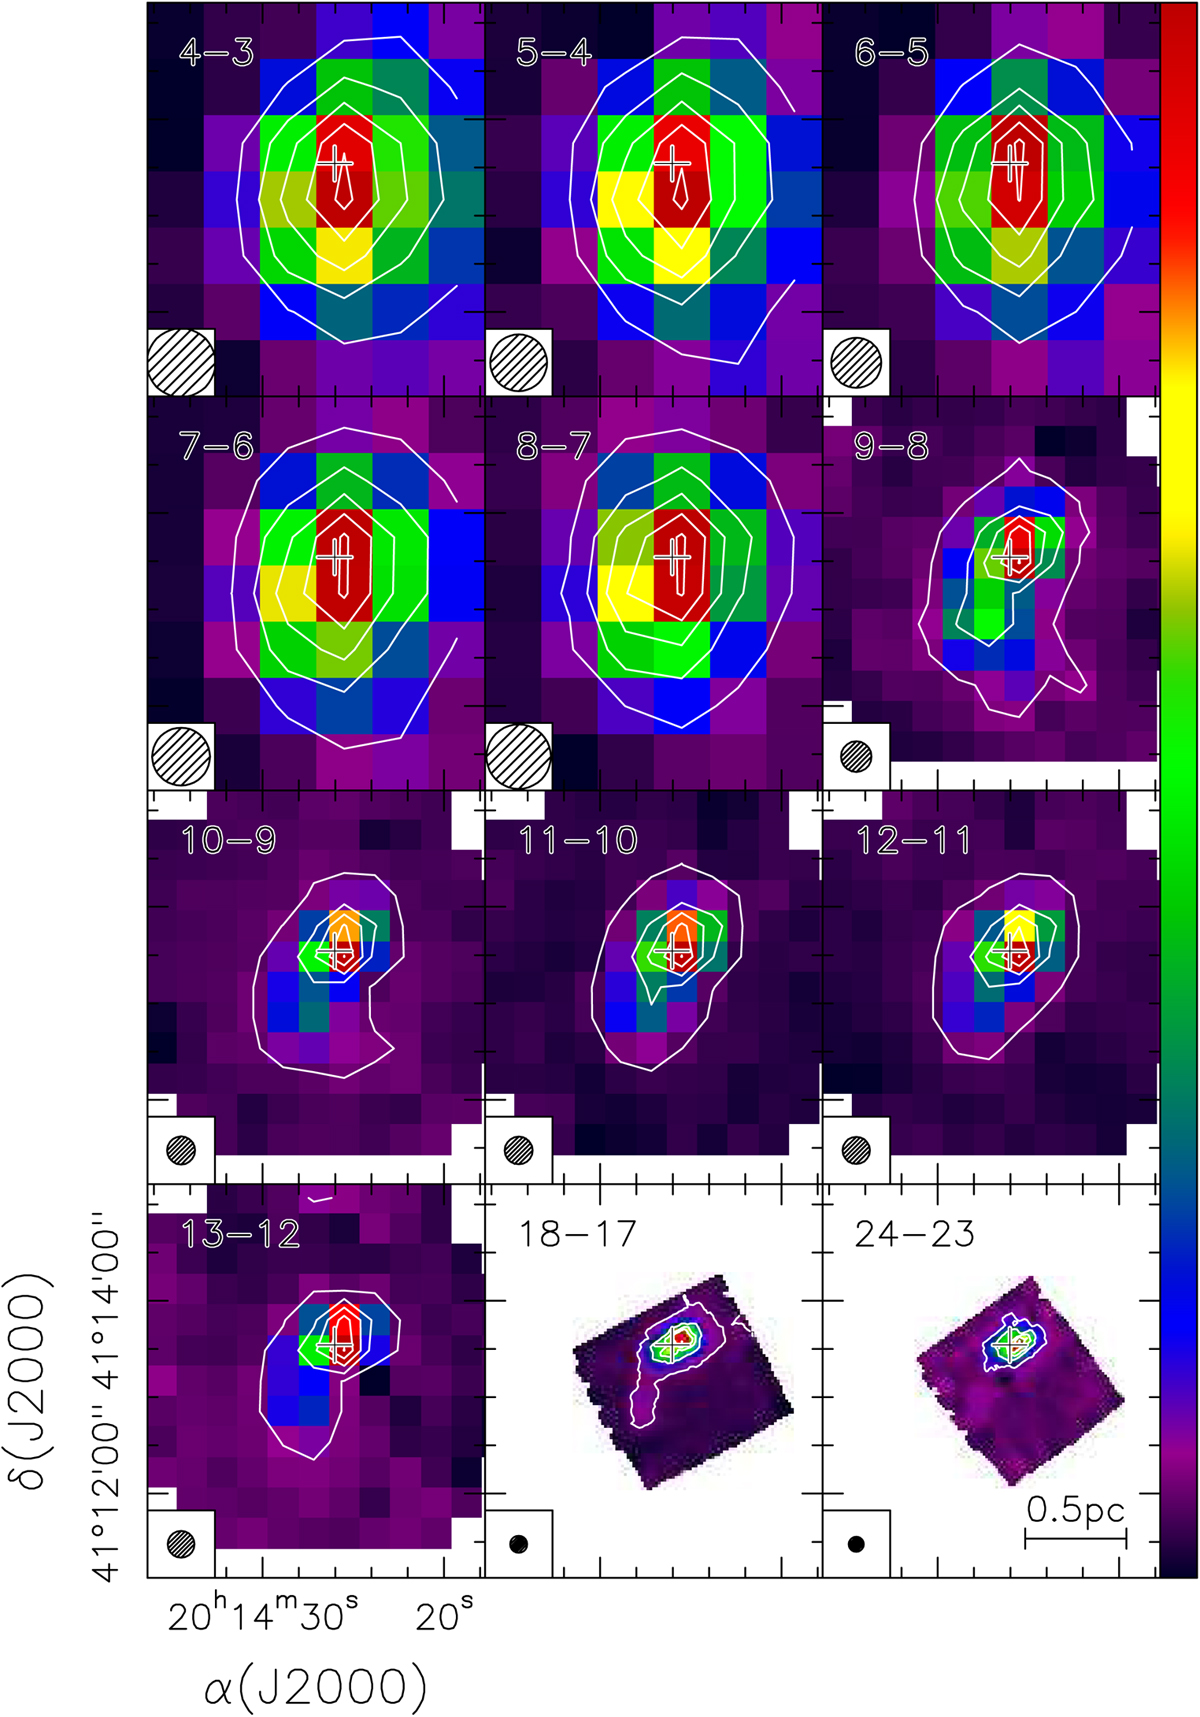
Fig. 3
Download original image
Maps of the emission averaged over the observed 12CO lines. The numbers in the top left of each panel indicate the J + 1 → J rotational transition, while the circle in the bottom left denotes the corresponding HPBW. The cross marks the position of the disk. The minimum, maximum, and step for contour levels in units of Jy beam–1 are as follows (panel by panel, from top to bottom, and from left to right): 3, 15.99, 3.25; 3, 19.63, 4.16; 3, 19.58, 4.14; 3, 25.79, 5.7 ; 3, 26.51, 5.88; 0.6, 15.98, 3.85; 0.6, 22.89, 5.57; 0.6, 21.25, 5.16; 0.6, 21.42, 5.2; 0.6, 16.99, 4.1; 0.39, 14.13, 3.43; 0.24, 3.69, 0.86.
Current usage metrics show cumulative count of Article Views (full-text article views including HTML views, PDF and ePub downloads, according to the available data) and Abstracts Views on Vision4Press platform.
Data correspond to usage on the plateform after 2015. The current usage metrics is available 48-96 hours after online publication and is updated daily on week days.
Initial download of the metrics may take a while.