Open Access
Fig. 2
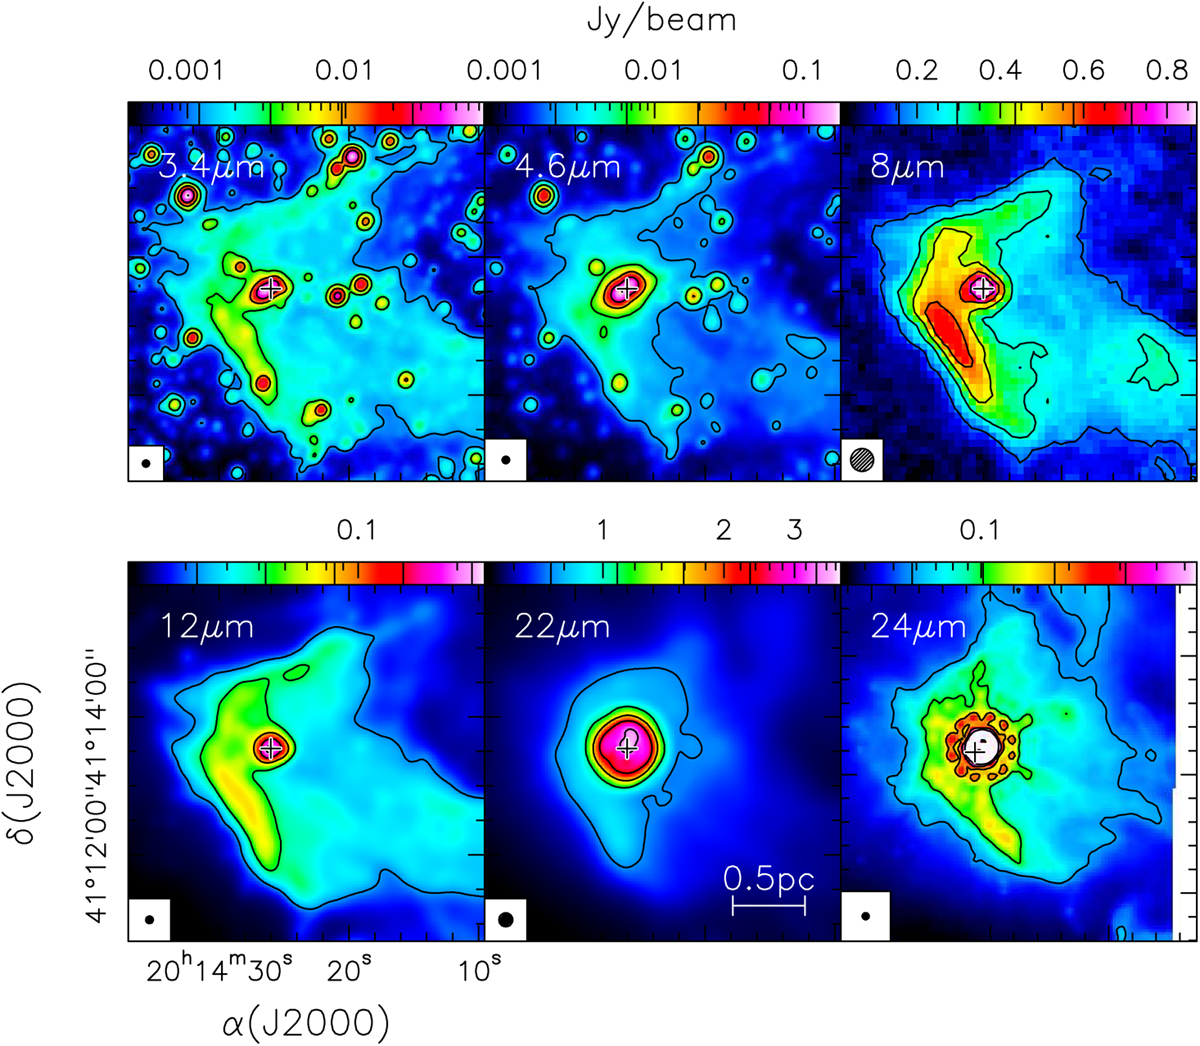
Download original image
Same as Fig. 1, but for archival images in the IR. The images at 3.4, 4.6, 12, and 22 μm are from the WISE survey, while those at 8 μm and 24 μm are from the MSX survey and the Spitzer database, respectively. The latter image is heavily saturated and shows the pattern of the point spread function of the telescope.
Current usage metrics show cumulative count of Article Views (full-text article views including HTML views, PDF and ePub downloads, according to the available data) and Abstracts Views on Vision4Press platform.
Data correspond to usage on the plateform after 2015. The current usage metrics is available 48-96 hours after online publication and is updated daily on week days.
Initial download of the metrics may take a while.