Fig. 13
Download original image
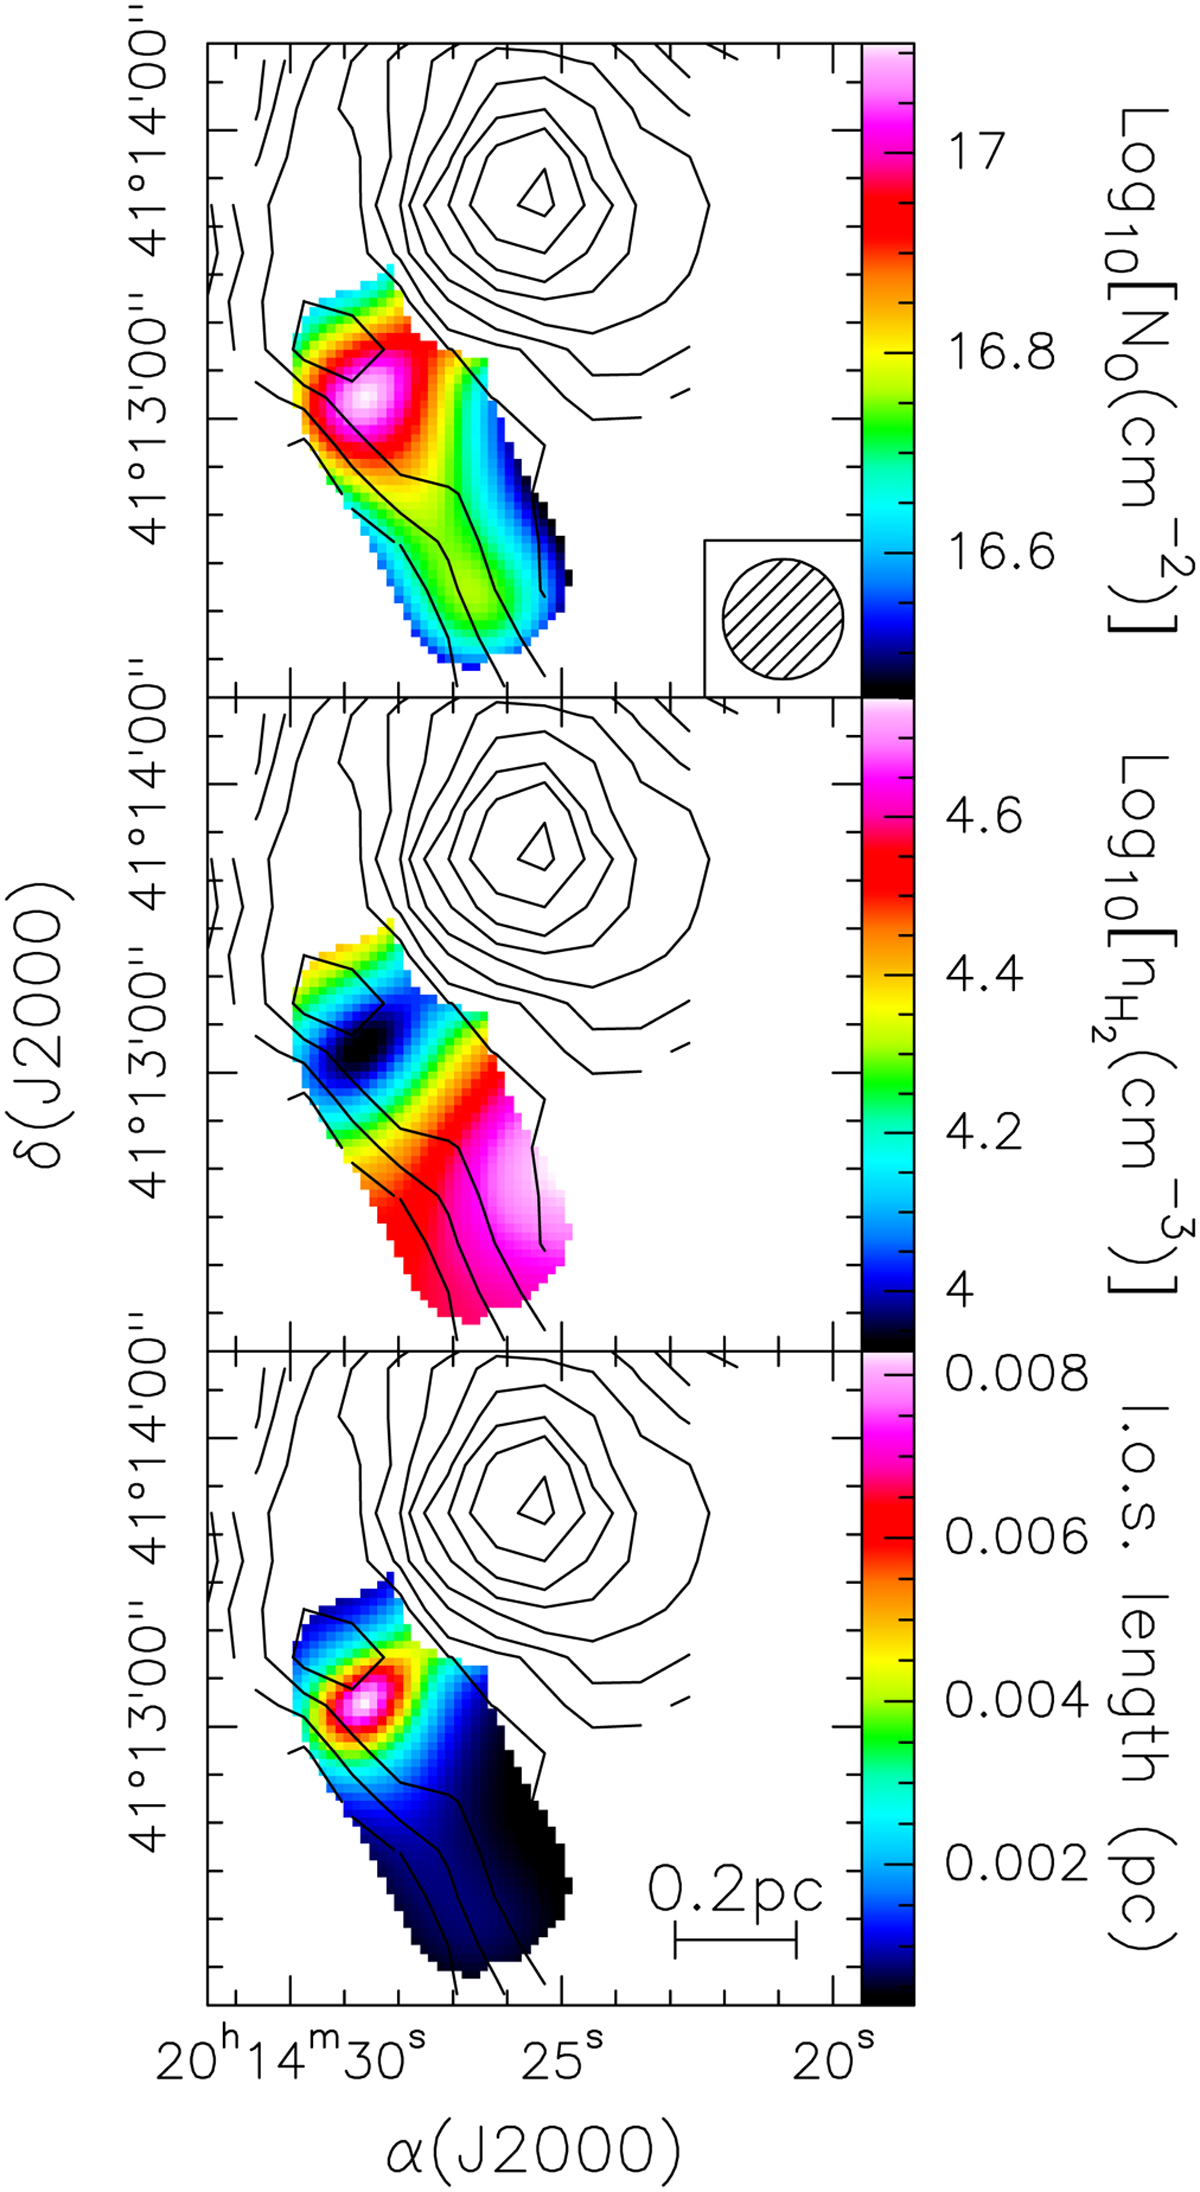
Maps of the oxygen column density (top panel) and molecular hydrogen volume density (middle panel) over the shocked region where OI emission is detected. The bottom panel shows a map of the geometrical thickness along the line of sight of the same region, derived from the ratio between NO and ![]() , assuming a constant oxygen abundance relative to molecular hydrogen of 6 × 10⁻⁴. The contours represent the same map of the gas column density as in Fig. 8.
, assuming a constant oxygen abundance relative to molecular hydrogen of 6 × 10⁻⁴. The contours represent the same map of the gas column density as in Fig. 8.
Current usage metrics show cumulative count of Article Views (full-text article views including HTML views, PDF and ePub downloads, according to the available data) and Abstracts Views on Vision4Press platform.
Data correspond to usage on the plateform after 2015. The current usage metrics is available 48-96 hours after online publication and is updated daily on week days.
Initial download of the metrics may take a while.