Fig. 12
Download original image
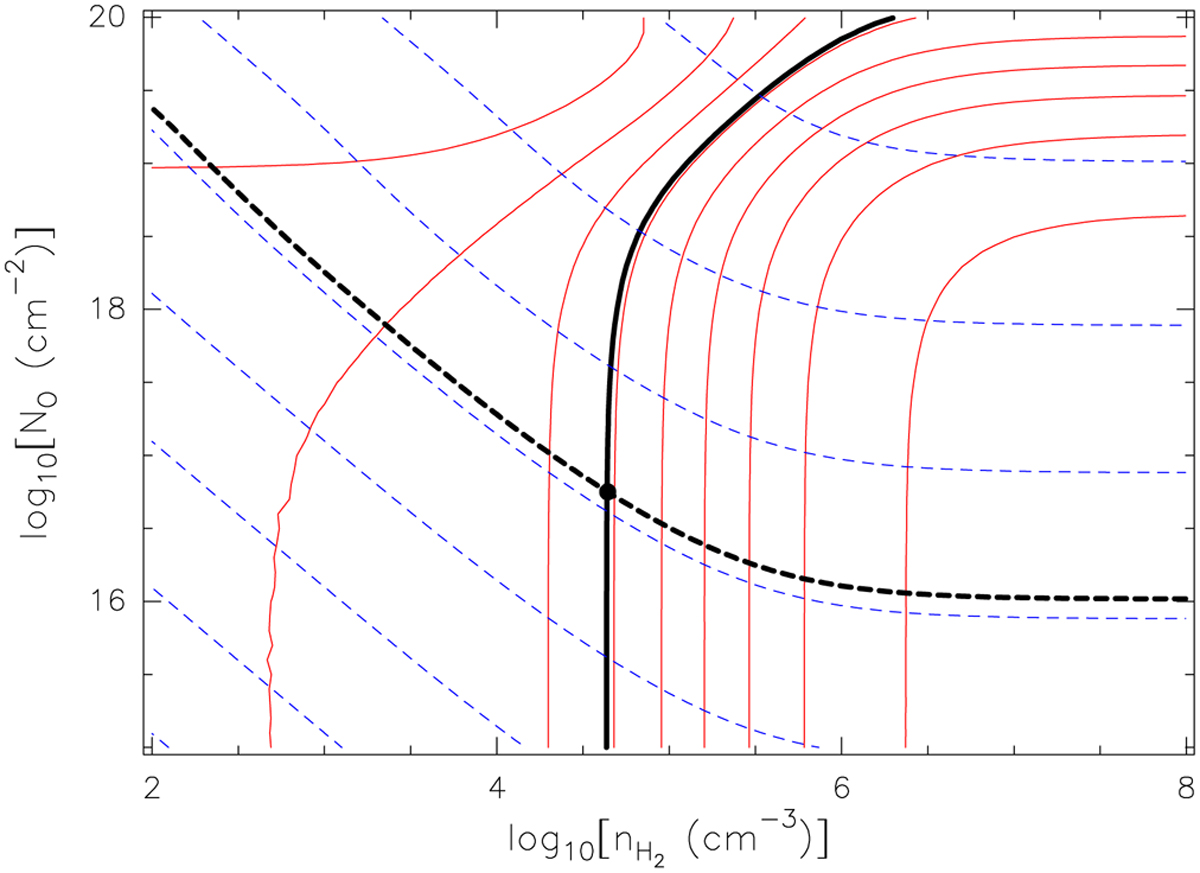
Example of the method used to estimate the oxygen column density and the molecular hydrogen volume density over the OI-emitting region. The solid red contours and the blue dashed contours are maps of ![]() , respectively. The solid, thick black contour and the black dashed contour correspond to the observed values of the same quantities. The dot marks the intersection between these two contours, which gives the pair of values of
, respectively. The solid, thick black contour and the black dashed contour correspond to the observed values of the same quantities. The dot marks the intersection between these two contours, which gives the pair of values of ![]() and NO (4.4 × 104 cm–3 and 5.6 × 1016 cm–2) that reproduce both observables.
and NO (4.4 × 104 cm–3 and 5.6 × 1016 cm–2) that reproduce both observables.
Current usage metrics show cumulative count of Article Views (full-text article views including HTML views, PDF and ePub downloads, according to the available data) and Abstracts Views on Vision4Press platform.
Data correspond to usage on the plateform after 2015. The current usage metrics is available 48-96 hours after online publication and is updated daily on week days.
Initial download of the metrics may take a while.