Fig. 11
Download original image
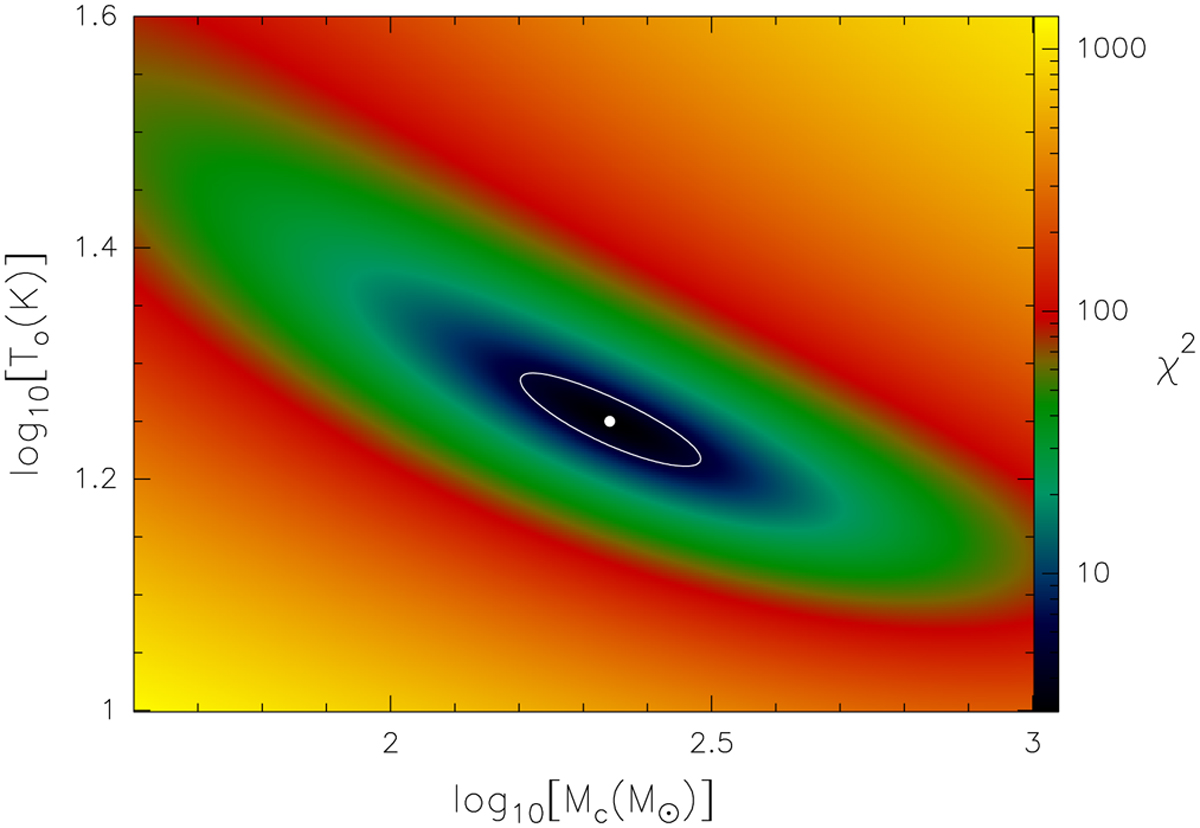
χ2 obtained by fitting the clump model of Cesaroni (2019) to the SED of IRAS 20126+4104 (shown in Fig. 6), as a function of the clump surface temperature and mass. For the ;χ2 calculation, we have assumed an error of 20% for all fluxes. The white dot marks the minimum corresponding to the best fit, while the white contour is the 1σ confidence level (i.e. 68% reliability) according to the criterion of Lampton et al. (1976).
Current usage metrics show cumulative count of Article Views (full-text article views including HTML views, PDF and ePub downloads, according to the available data) and Abstracts Views on Vision4Press platform.
Data correspond to usage on the plateform after 2015. The current usage metrics is available 48-96 hours after online publication and is updated daily on week days.
Initial download of the metrics may take a while.