Fig. 10
Download original image
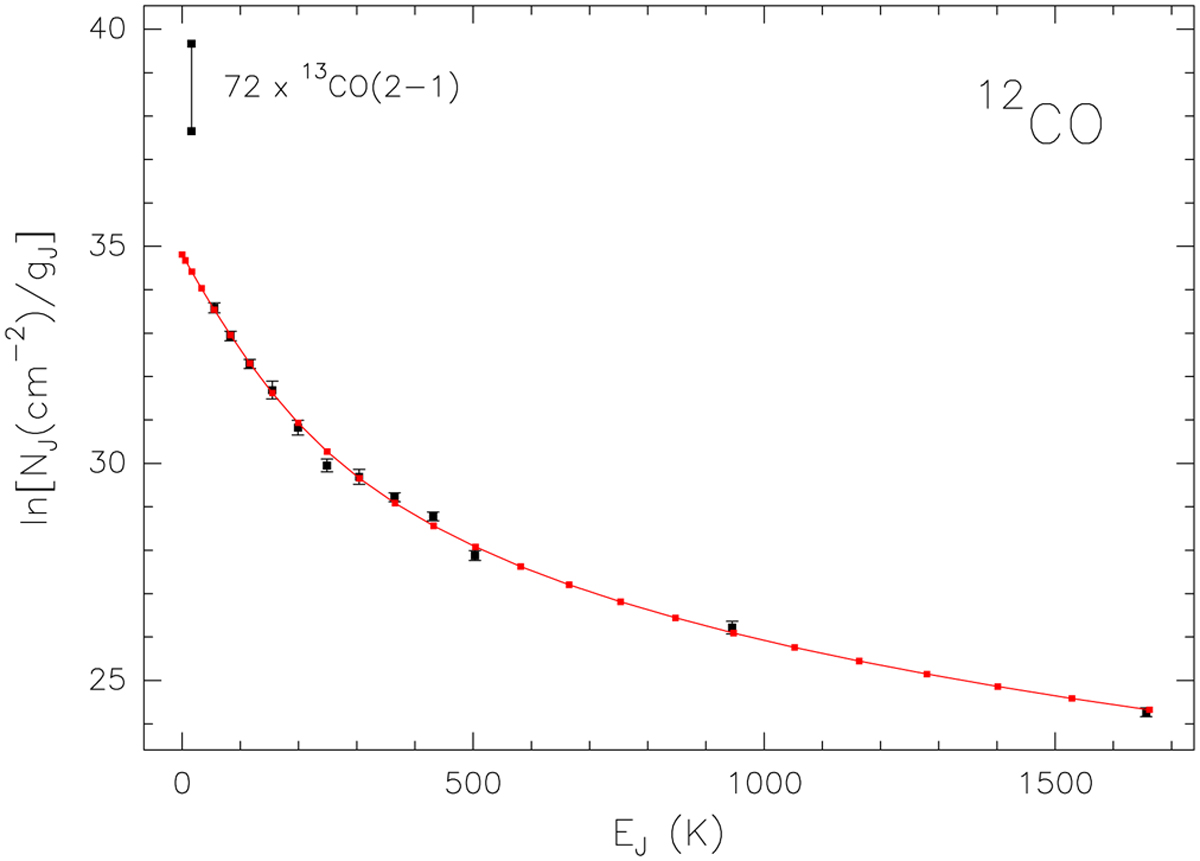
Rotation diagram of 12CO. The black points with error bars represent the Herschel data, whereas the two black points connected by a bar are the lower and upper limit to the13 CO column density in the J = 2 level obtained from the13 CO(2–1) data of Cesaroni et al. (1999b) after multiplying the column density for a 12CO/13 CO abundance ratio of 72. The red points connected by the curve are the best fit to the Herschel data obtained with the model described in Appendix A.
Current usage metrics show cumulative count of Article Views (full-text article views including HTML views, PDF and ePub downloads, according to the available data) and Abstracts Views on Vision4Press platform.
Data correspond to usage on the plateform after 2015. The current usage metrics is available 48-96 hours after online publication and is updated daily on week days.
Initial download of the metrics may take a while.