Fig. 9
Download original image
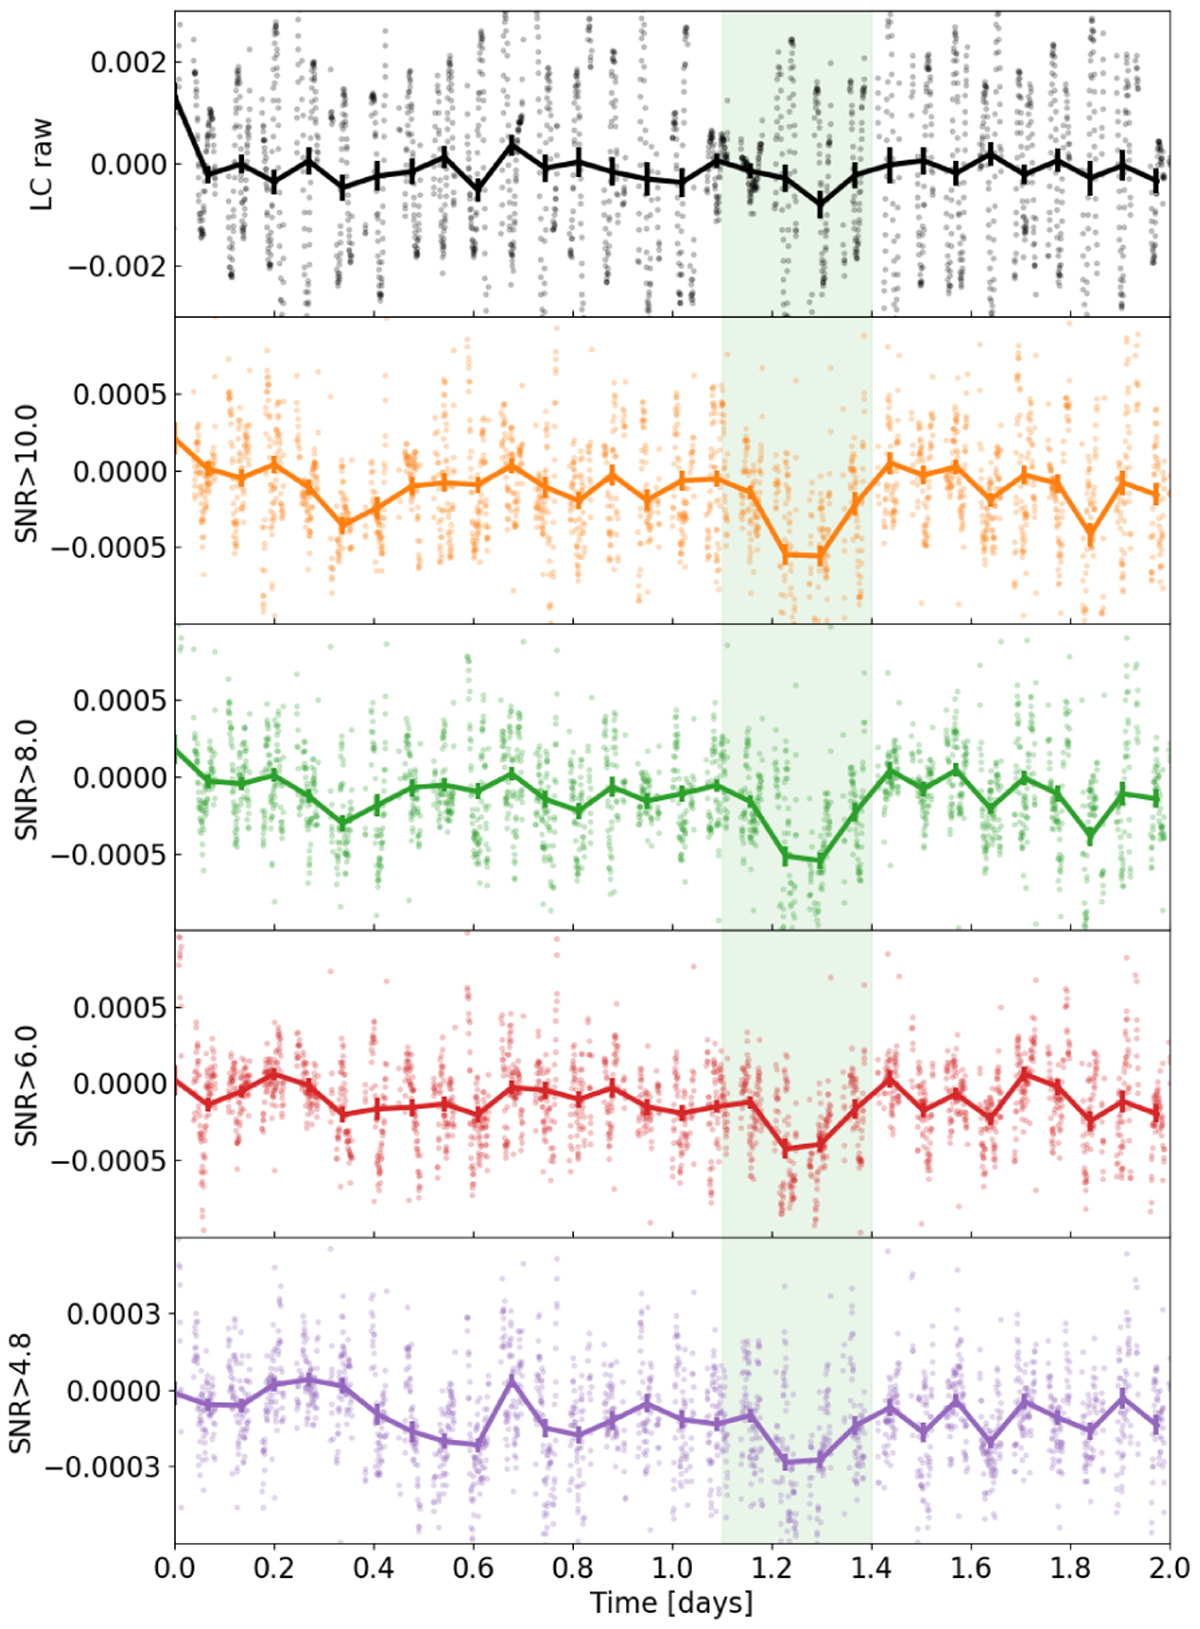
Recovery of an injected transient signal (green filled area) at about t − t0 = 1.2 days from detrended light curves where the removed δ Scuti oscillations have the same S/N levels as analysed here with the same colour code as in Fig. 5. The raw light curve with the injected signal is shown on top (black line). The adopted bin step is also 1.645 h.
Current usage metrics show cumulative count of Article Views (full-text article views including HTML views, PDF and ePub downloads, according to the available data) and Abstracts Views on Vision4Press platform.
Data correspond to usage on the plateform after 2015. The current usage metrics is available 48-96 hours after online publication and is updated daily on week days.
Initial download of the metrics may take a while.