Fig. 5
Download original image
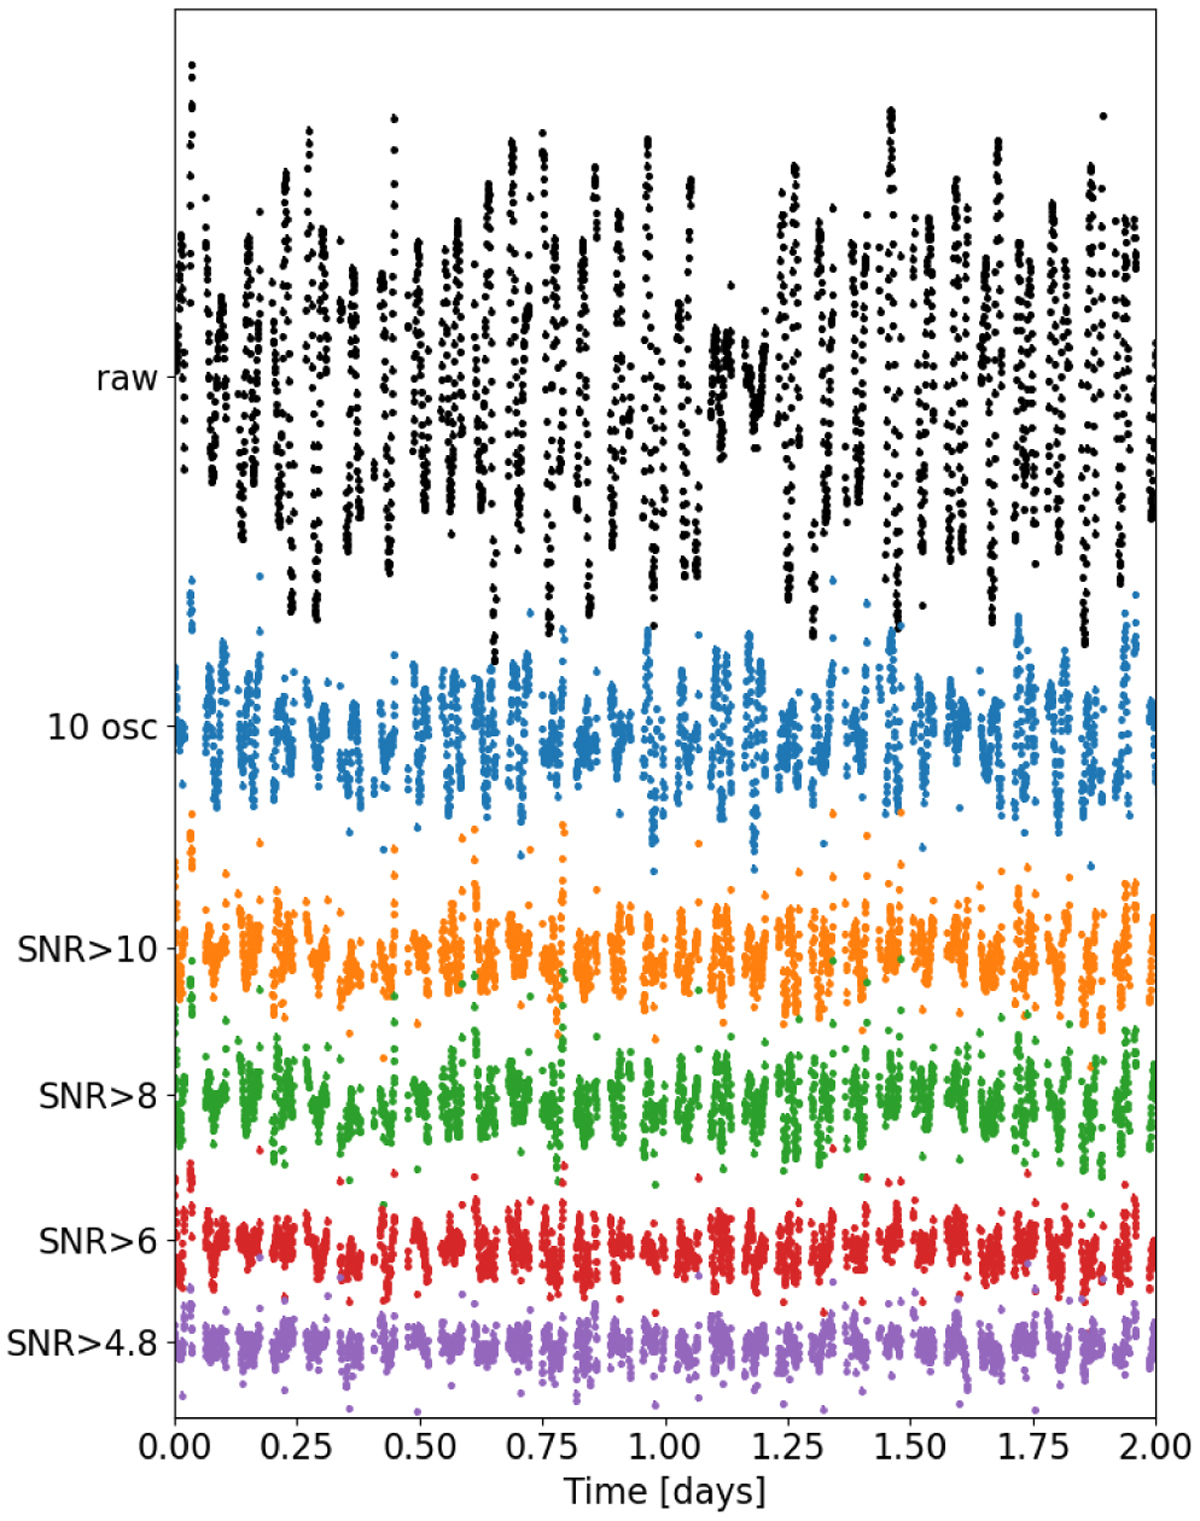
HD 172555’s light curve after the removal of δ Scuti variations with different degrees of precision (see text). From top to bottom: raw light curve (black), the ten dominant frequencies subtracted (blue), and the oscillations subtracted with S/N > 10 (orange), S/N > 8 (green), S/N > 6 (red), and S/N > 4.8 (purple). The vertical scale is common to all curves, allowing for the effect of the different δ Scuti removal schemes on the residuals’ amplitude to be compared.
Current usage metrics show cumulative count of Article Views (full-text article views including HTML views, PDF and ePub downloads, according to the available data) and Abstracts Views on Vision4Press platform.
Data correspond to usage on the plateform after 2015. The current usage metrics is available 48-96 hours after online publication and is updated daily on week days.
Initial download of the metrics may take a while.