Open Access
Fig. 4.
Download original image
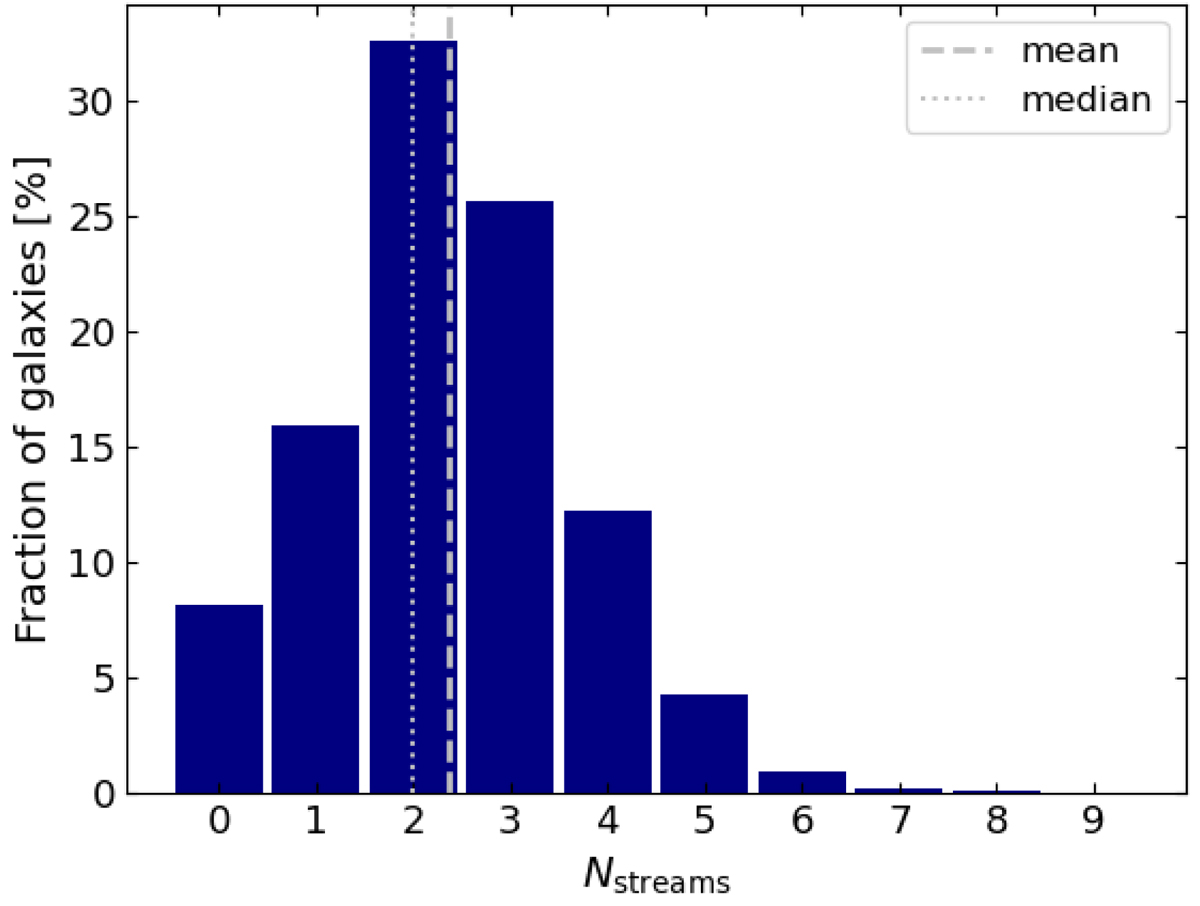
Histogram of the number of streams, Nstreams, connected to each galaxy of the full galaxy catalogue. The vertical dotted and dashed lines show the mean and median values, respectively. The number of streams to which a galaxy is connected defines the galaxy connectivity.
Current usage metrics show cumulative count of Article Views (full-text article views including HTML views, PDF and ePub downloads, according to the available data) and Abstracts Views on Vision4Press platform.
Data correspond to usage on the plateform after 2015. The current usage metrics is available 48-96 hours after online publication and is updated daily on week days.
Initial download of the metrics may take a while.