Open Access
Fig. 3.
Download original image
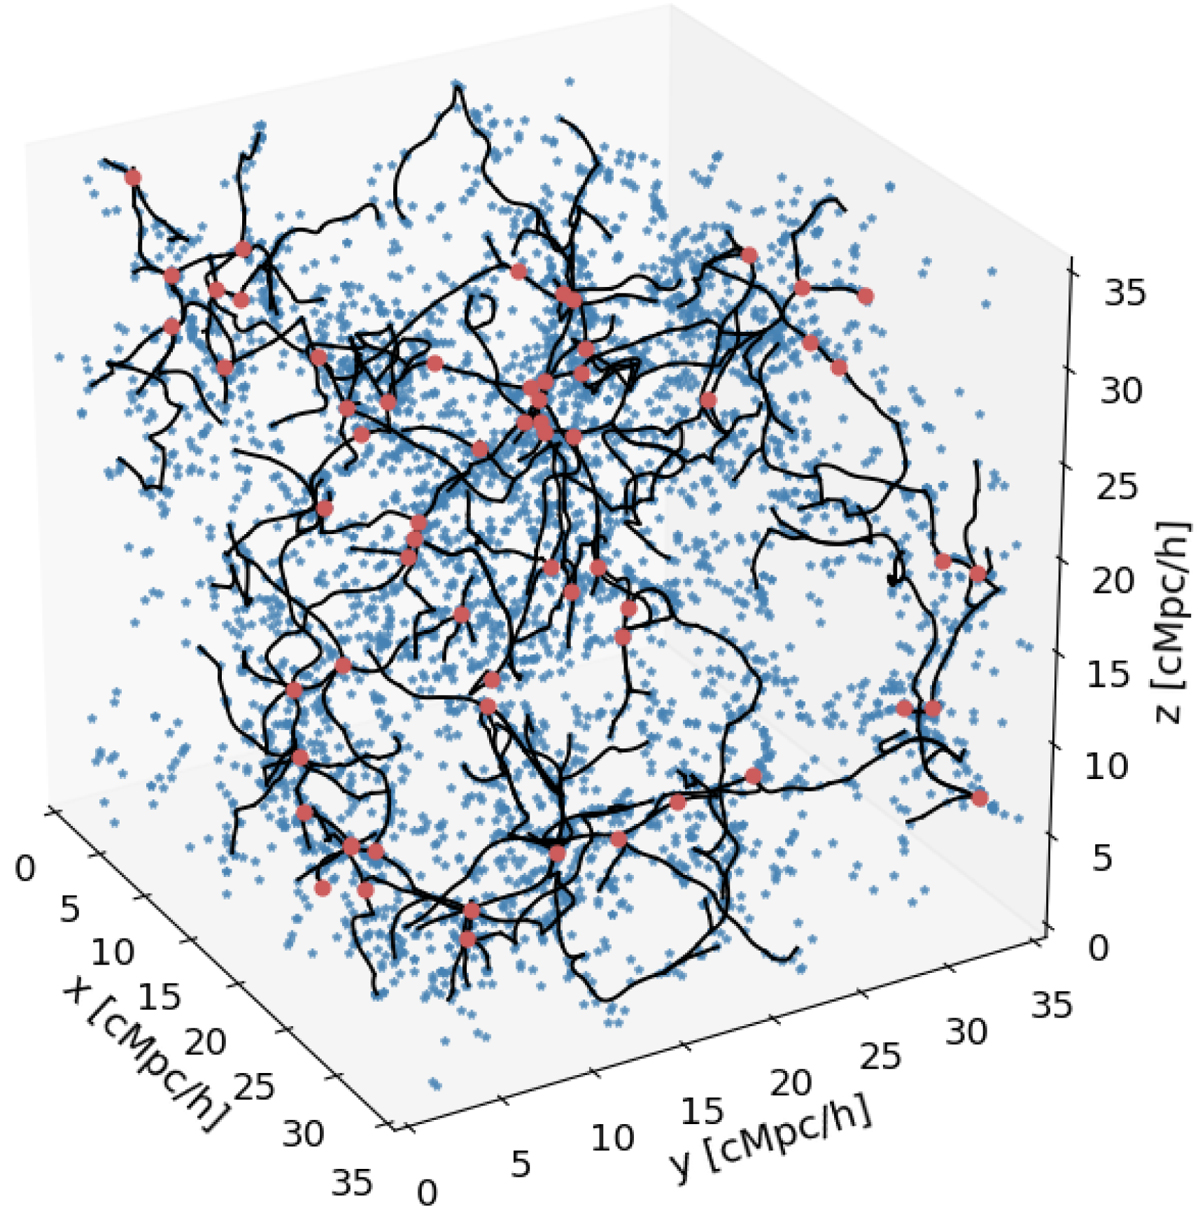
Cosmic filaments (black lines) of the full TNG50-1 simulation. The red dots show the position of clusters of galaxies, i.e. the FoF haloes with masses M200 > 1012 M⊙/h. The blue stars correspond to the 2942 central galaxies analysed in this work. The detection of the cosmic skeleton is presented in Sect. 3.3.
Current usage metrics show cumulative count of Article Views (full-text article views including HTML views, PDF and ePub downloads, according to the available data) and Abstracts Views on Vision4Press platform.
Data correspond to usage on the plateform after 2015. The current usage metrics is available 48-96 hours after online publication and is updated daily on week days.
Initial download of the metrics may take a while.