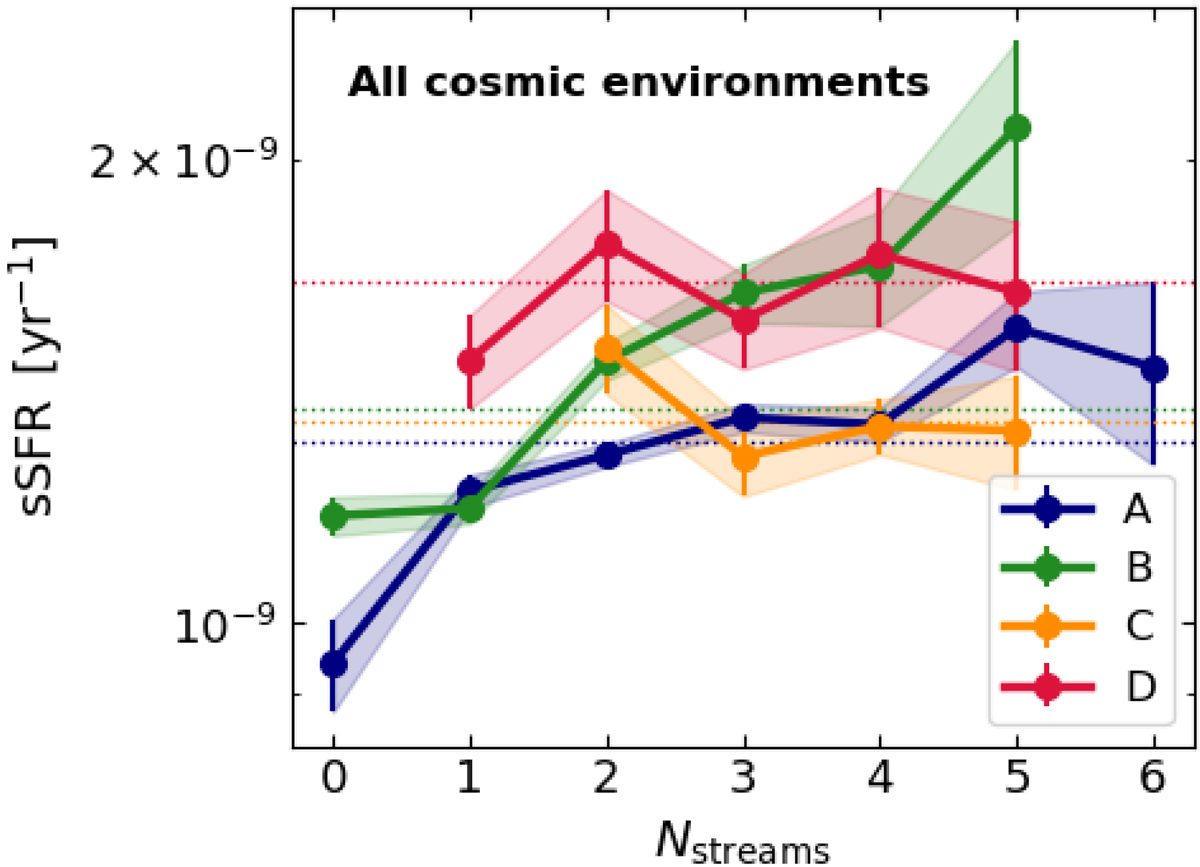
Fig. 12.
Download original image
Influence of galaxy connectivity on star formation. The curves show the mean galaxy sSFR as a function of connectivity for the four different galaxy populations from A to D presented in Fig. 8. The horizontal lines show the average sSFR of all the galaxies in a given population, regardless of the connectivity value. We note that the y-axis is in logarithmic scale.
Current usage metrics show cumulative count of Article Views (full-text article views including HTML views, PDF and ePub downloads, according to the available data) and Abstracts Views on Vision4Press platform.
Data correspond to usage on the plateform after 2015. The current usage metrics is available 48-96 hours after online publication and is updated daily on week days.
Initial download of the metrics may take a while.