Fig. 11.
Download original image
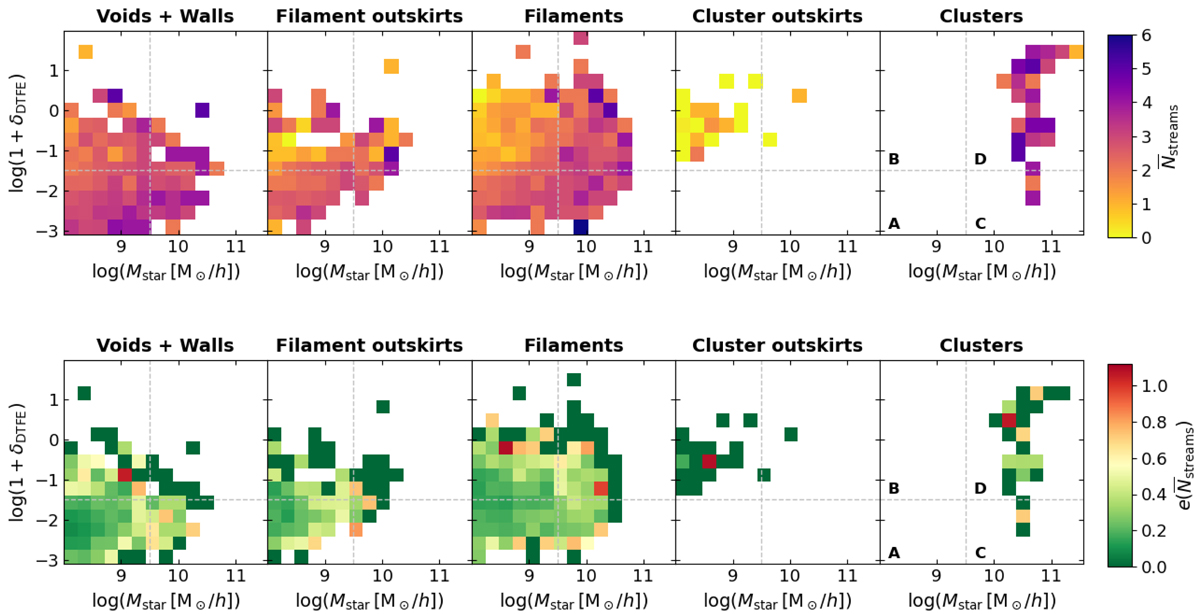
Top: mean galaxy connectivity (shown by the pixel colours) in the mass vs. 1 + δDTFE plane as a function of cosmic environments (from left to right panels). The dashed grey lines show the limits of the four different galaxy populations studied in Sect. 6. Bottom: corresponding bootstrap errors. The dark green pixels (error values of zero) need to be interpreted with caution as they represent bins with only one galaxy (see the number counts in Fig. E.2).
Current usage metrics show cumulative count of Article Views (full-text article views including HTML views, PDF and ePub downloads, according to the available data) and Abstracts Views on Vision4Press platform.
Data correspond to usage on the plateform after 2015. The current usage metrics is available 48-96 hours after online publication and is updated daily on week days.
Initial download of the metrics may take a while.