Fig. 1.
Download original image
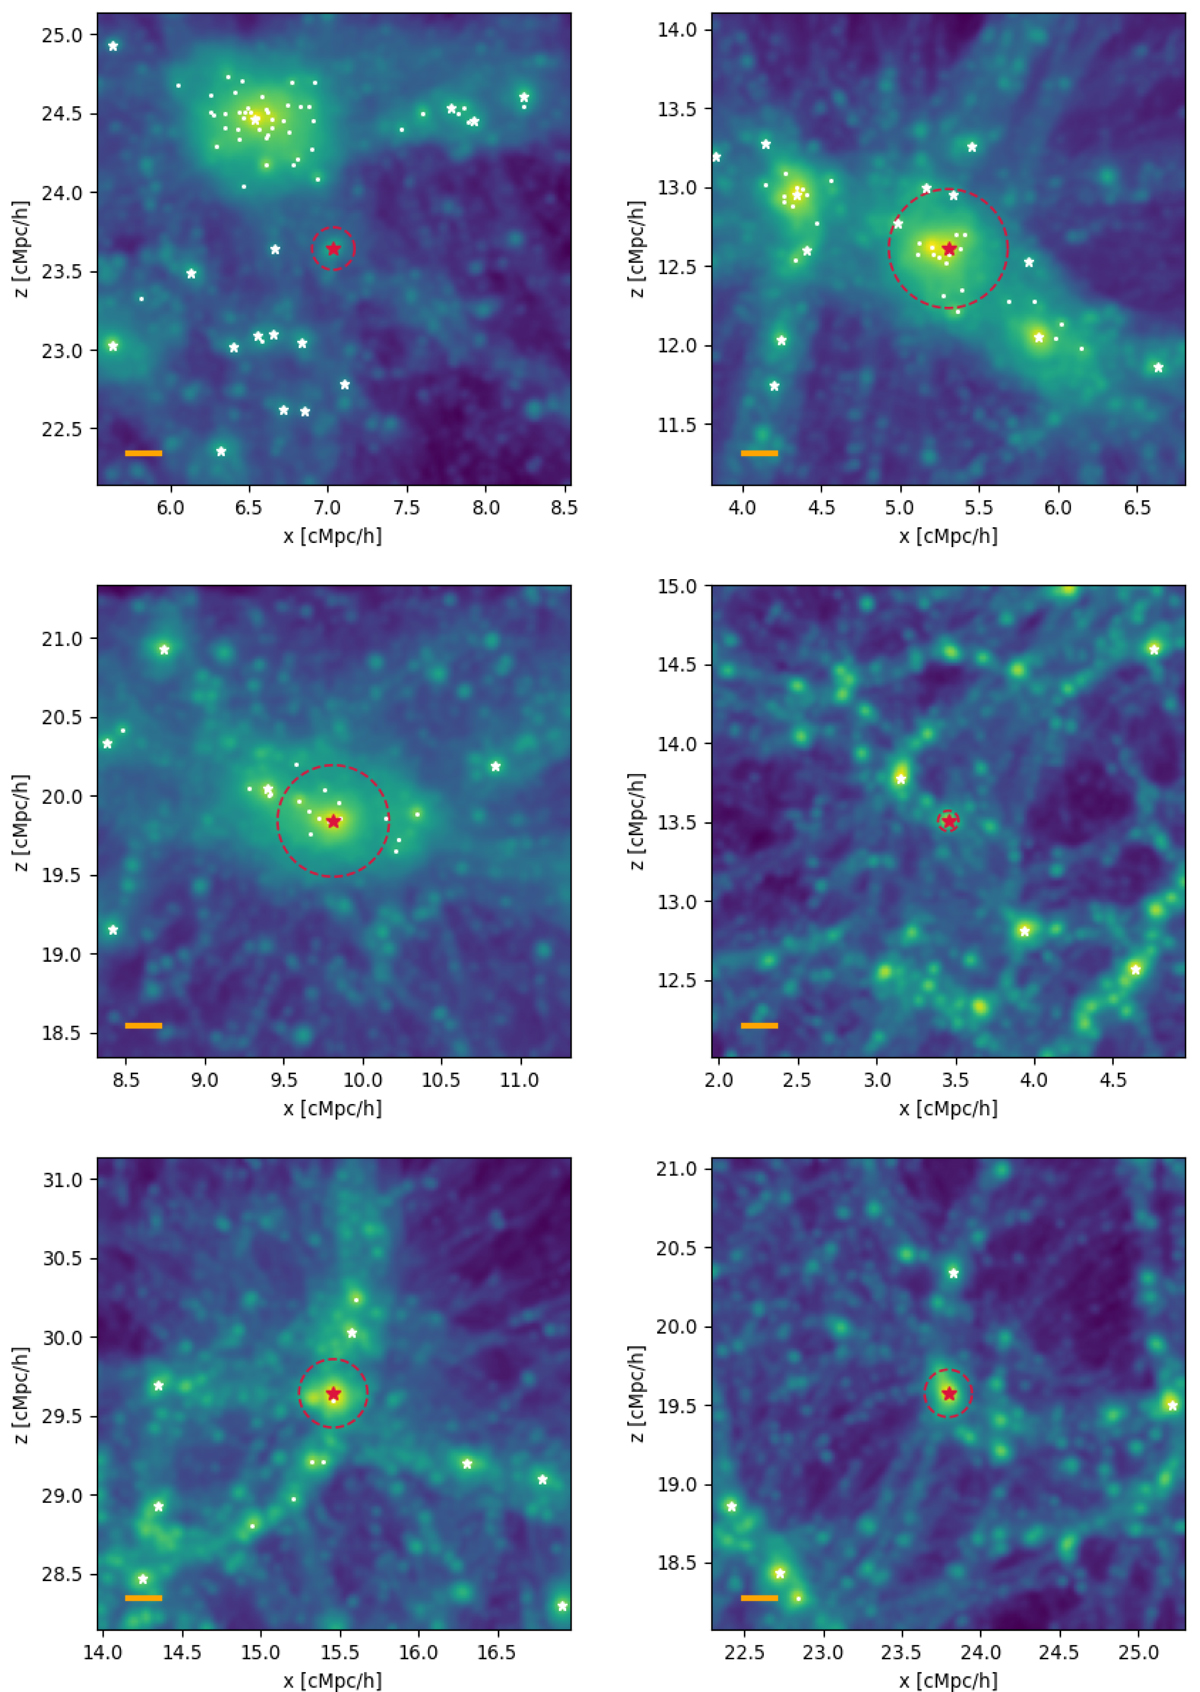
Examples of 2D projected DM density fields. For each sub-box with a side of 3 cMpc/h, the red star and red circle correspond to the analysed central galaxy of mass M* > 108 M⊙ and to the R200 radius of its host FoF halo, respectively. The small white stars and white dots indicate other centrals and satellite galaxies located in the sub-box, respectively. The length of the orange line in the bottom left part of the panels corresponds to ten times the resolution scale of the grid chosen to project the DM density and extract the skeleton, i.e. ten times 20 ckpc/h.
Current usage metrics show cumulative count of Article Views (full-text article views including HTML views, PDF and ePub downloads, according to the available data) and Abstracts Views on Vision4Press platform.
Data correspond to usage on the plateform after 2015. The current usage metrics is available 48-96 hours after online publication and is updated daily on week days.
Initial download of the metrics may take a while.