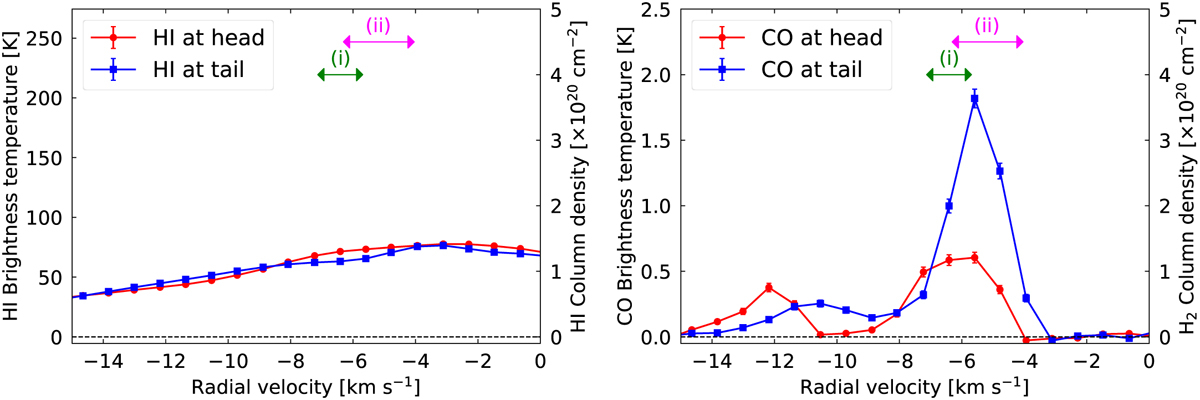
Fig. B.1
Download original image
HI (left) and 12CO (J = 1 − 0) (right) radial profile at the head and tail region. In both panels, red and blue data represent the profile of the head and tail regions. The green arrow labelled (i) show the velocity ranges pointed out by Kothes et al. (2001), while the magenta arrow labelled (ii) is those of Acciari et al. (2009) and Albert et al. (2020).
Current usage metrics show cumulative count of Article Views (full-text article views including HTML views, PDF and ePub downloads, according to the available data) and Abstracts Views on Vision4Press platform.
Data correspond to usage on the plateform after 2015. The current usage metrics is available 48-96 hours after online publication and is updated daily on week days.
Initial download of the metrics may take a while.