Fig. 5
Download original image
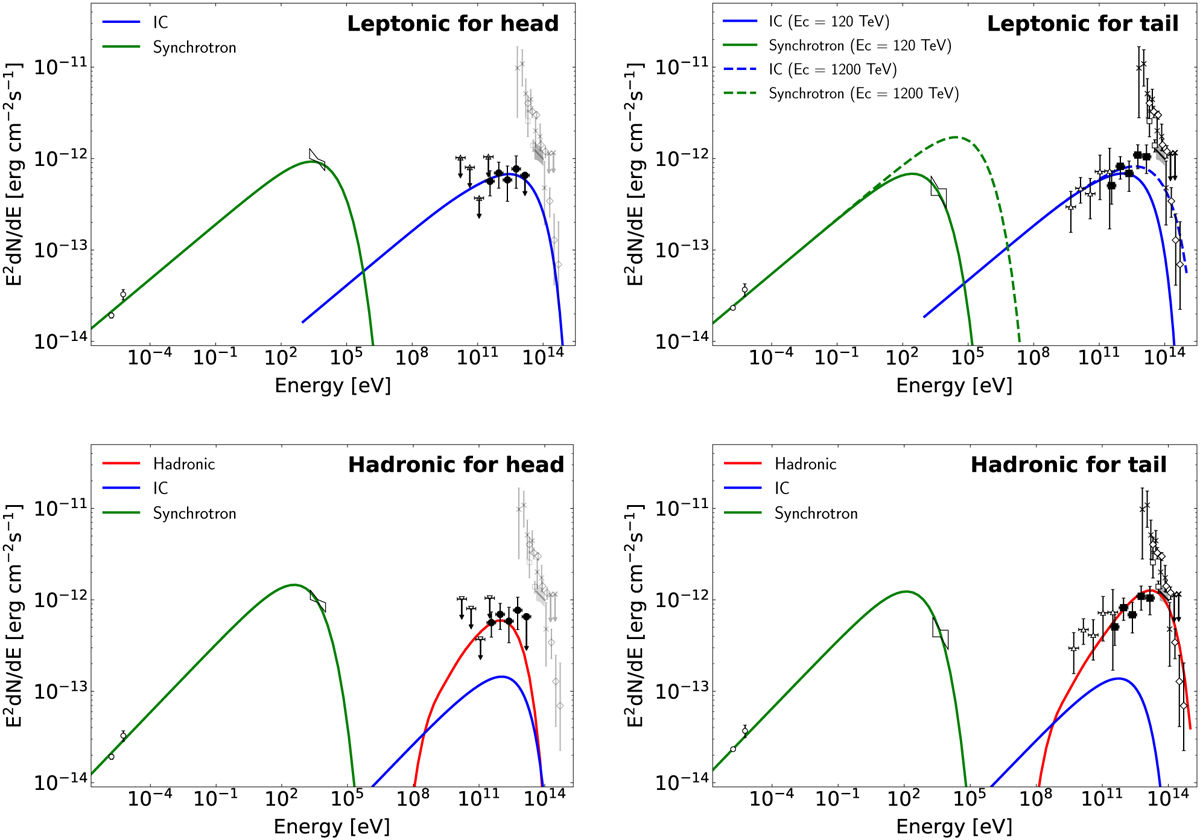
Modeling of the SED of SNR G106.3+2.7. The left and right panels show the results of the head and the tail, respectively. The top and bottom panels show the results of the leptonic and hadronic models, respectively. The white circles show the radio flux of each region (Pineault & Joncas 2000). The black bow-tie area shows a power-law fit and 1σ statistical errors measured by Suzaku (Fujita et al. 2021). The open triangles show the Fermi-LAT measurements (Xin et al. 2019; Liu et al. 2020). The markers in the TeV γ-ray band are the same as in Fig. 4, but those corresponding to the MAGIC data are shown in black here. The red, blue and green lines show the hadronic, IC and synchrotron emission. The model parameters of each panel are summarized in Table 3. In the top-right panel, the solid and dashed lines show the leptonic emission with the energy cutoff of 120 and 1200 TeV, respectively.
Current usage metrics show cumulative count of Article Views (full-text article views including HTML views, PDF and ePub downloads, according to the available data) and Abstracts Views on Vision4Press platform.
Data correspond to usage on the plateform after 2015. The current usage metrics is available 48-96 hours after online publication and is updated daily on week days.
Initial download of the metrics may take a while.