Fig. 4
Download original image
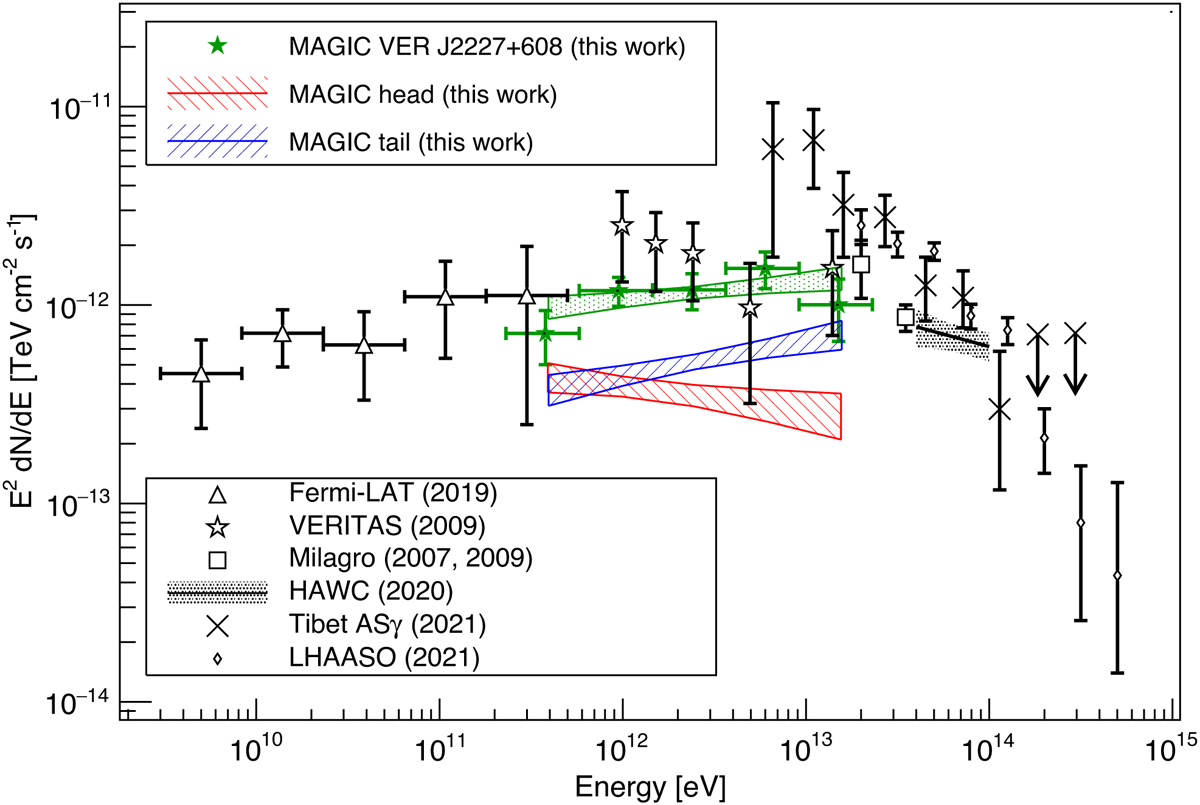
Spectral energy distribution of the whole region of SNR G106.3+2.7. Green data represent the spectrum of the VER J2227+608 region as measured with the MAGIC telescopes. The shaded blue and red regions show the same areas as in Fig. 3. The open triangles, open stars, open squares, x marks, and open diamonds show the Fermi-LAT (Xin et al. 2019), VERITAS (Acciari et al. 2009), Milagro Abdo et al. (2007, 2009b), Tibet ASγ (Amenomori et al. 2021), and LHAASO measurements (Cao et al. 2021), respectively. The black bow-tie area shows a power-law fit and 1σ statistical errors measured by HAWC (Albert et al. 2020).
Current usage metrics show cumulative count of Article Views (full-text article views including HTML views, PDF and ePub downloads, according to the available data) and Abstracts Views on Vision4Press platform.
Data correspond to usage on the plateform after 2015. The current usage metrics is available 48-96 hours after online publication and is updated daily on week days.
Initial download of the metrics may take a while.