Fig. 2
Download original image
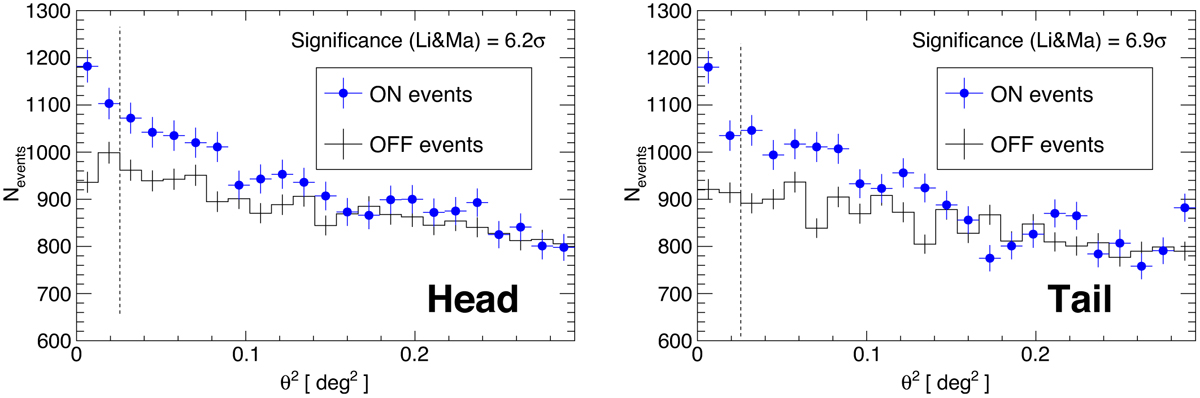
θ2 distributions of ON (blue circles) and OFF (black line) events above 0.2 TeV towards the centre of the head region (left) and that of the tail region (right). The region between zero and the vertical dashed line (at θ2 = 0.0256 deg2) was used to estimate ON and OFF events. The OFF data represent the average of six regions rotated by 120 and 240 deg with respect to each wobble centre from the ON region.
Current usage metrics show cumulative count of Article Views (full-text article views including HTML views, PDF and ePub downloads, according to the available data) and Abstracts Views on Vision4Press platform.
Data correspond to usage on the plateform after 2015. The current usage metrics is available 48-96 hours after online publication and is updated daily on week days.
Initial download of the metrics may take a while.