Fig. 1
Download original image
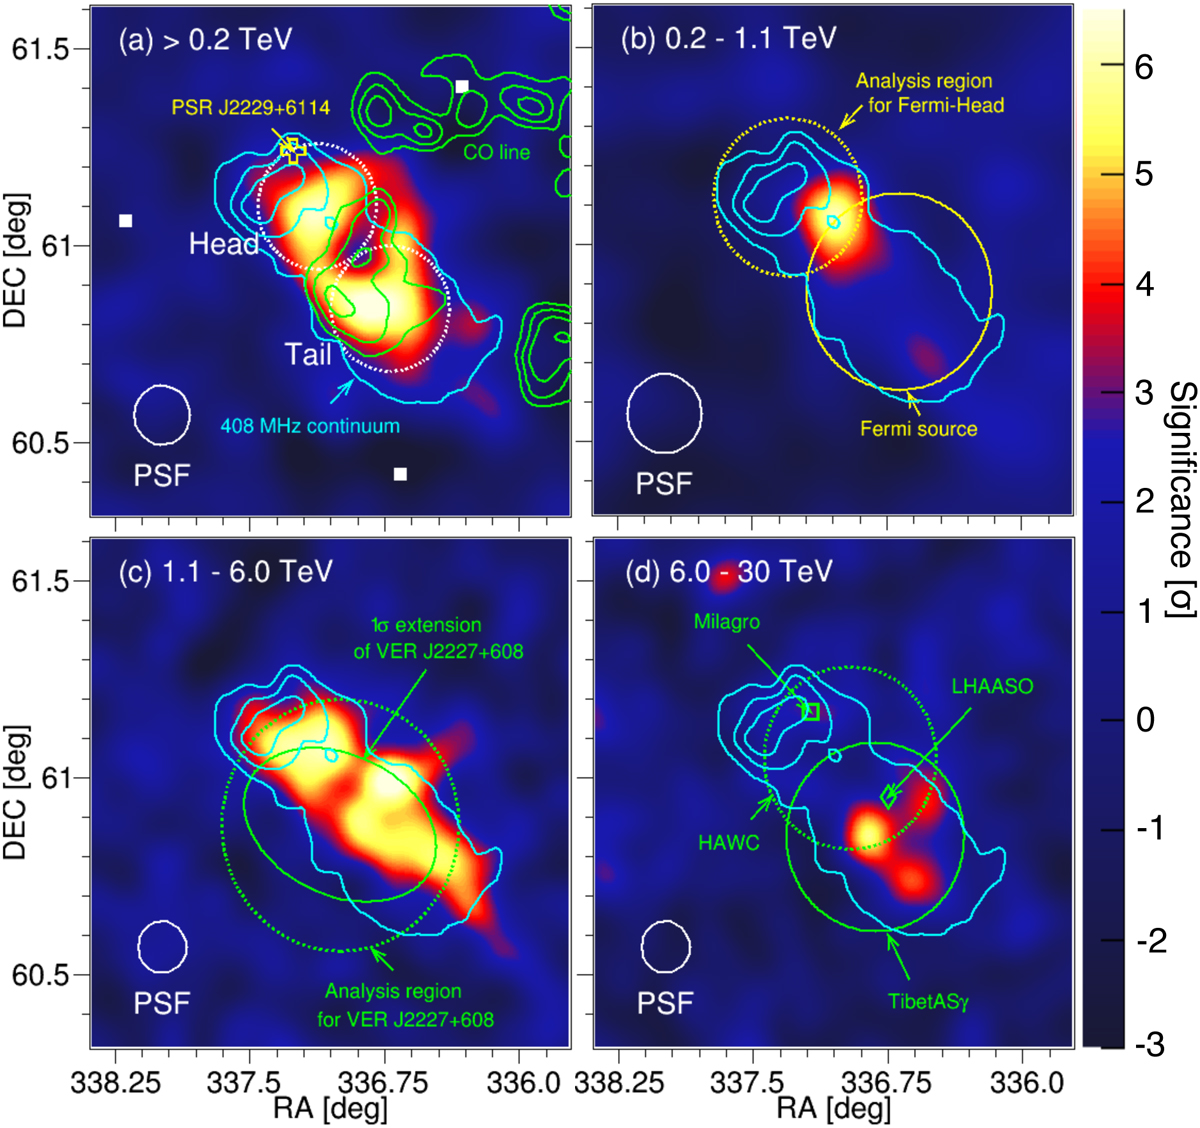
Energy-dependent pre-trial significance maps of SNR G106.3+2.7 observed with the MAGIC telescopes. (a) Map above 0.2 TeV. The white circle labeled 'PSF' represents the 0.075° size of a Gaussian kernel (corresponding to the MAGIC γ-ray PSF) for this analysis. The position of PSR J2229.0+6114 is marked with the open yellow cross. The cyan contours (overlaid on all panels) show the radio emission of SNR G106.3+2.7 at 408 MHz by DRAO (Pineault & Joncas 2000). The green contours represent the 12CO (J = 1 – 0) line intensity integrated over the velocity range from −6.41 to −3.94 km s−1. The white dotted circles show θ2 cut regions of the head and tail regions, respectively, as shown in Table 1. Also shown by white squares are the pointing positions used in the observations. (b) Map at 0.2−1.1 TeV. The white circle labelled 'PSF' represents the 0.100° size of a Gaussian kernel, as in panel a. The yellow solid and dotted circles represent the extension and location of the Fermi-LAT source (Xin et al. 2019) and the analysis region for the head region used in Liu et al. (2020), respectively. (c) Map at 1.1–6.0 TeV. The white circle labelled 'PSF' represents the 0.065° size of a Gaussian kernel, as in panel b. The green ellipse and dotted circles represent the extended TeV γ-ray emission of VER J2227+608 and θ2 cut region used in the VERITAS paper (Acciari et al. 2009), respectively. (d) Map at 6.0–30 TeV. The white circle labelled 'PSF' represents the 0.065° size of a Gaussian kernel, as in panel c. The green solid and dotted circles represent the extended γ-ray emission above 10 TeV observed with Tibet ASγ (Amenomori et al. 2021) and the upper limit at 90% confidence level of the Gaussian extension of HAWC J2227+610 (Albert et al. 2020), respectively. The open square and diamond show the centroid of the VHE γ-ray emission detected with Milagro (Abdo et al. 2009b) and LHAASO (Cao et al. 2021), respectively.
Current usage metrics show cumulative count of Article Views (full-text article views including HTML views, PDF and ePub downloads, according to the available data) and Abstracts Views on Vision4Press platform.
Data correspond to usage on the plateform after 2015. The current usage metrics is available 48-96 hours after online publication and is updated daily on week days.
Initial download of the metrics may take a while.