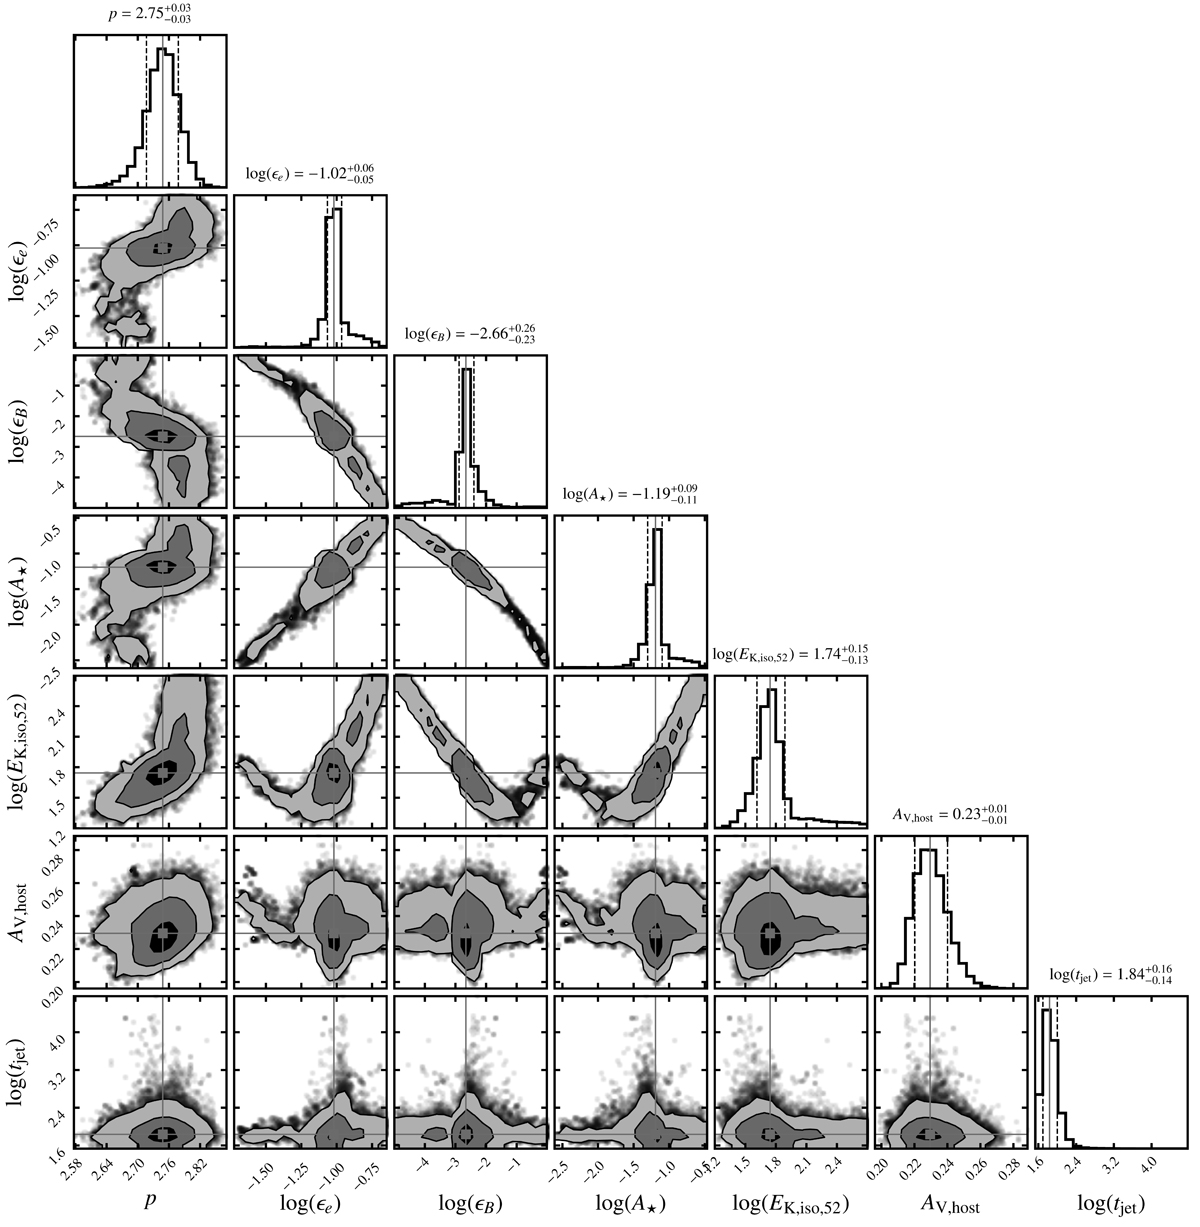
Fig. 8.
Download original image
Corner plot showing the marginalised posterior distributions for each model parameter along with the 2D marginalised posterior distributions for each pair of model parameters, from our MCMC analysis. Contours are at the 1σ, 2σ, and 3σ levels, and the red lines denote the median values derived from the marginalised posterior distributions for each model parameter.
Current usage metrics show cumulative count of Article Views (full-text article views including HTML views, PDF and ePub downloads, according to the available data) and Abstracts Views on Vision4Press platform.
Data correspond to usage on the plateform after 2015. The current usage metrics is available 48-96 hours after online publication and is updated daily on week days.
Initial download of the metrics may take a while.