Fig. 7.
Download original image
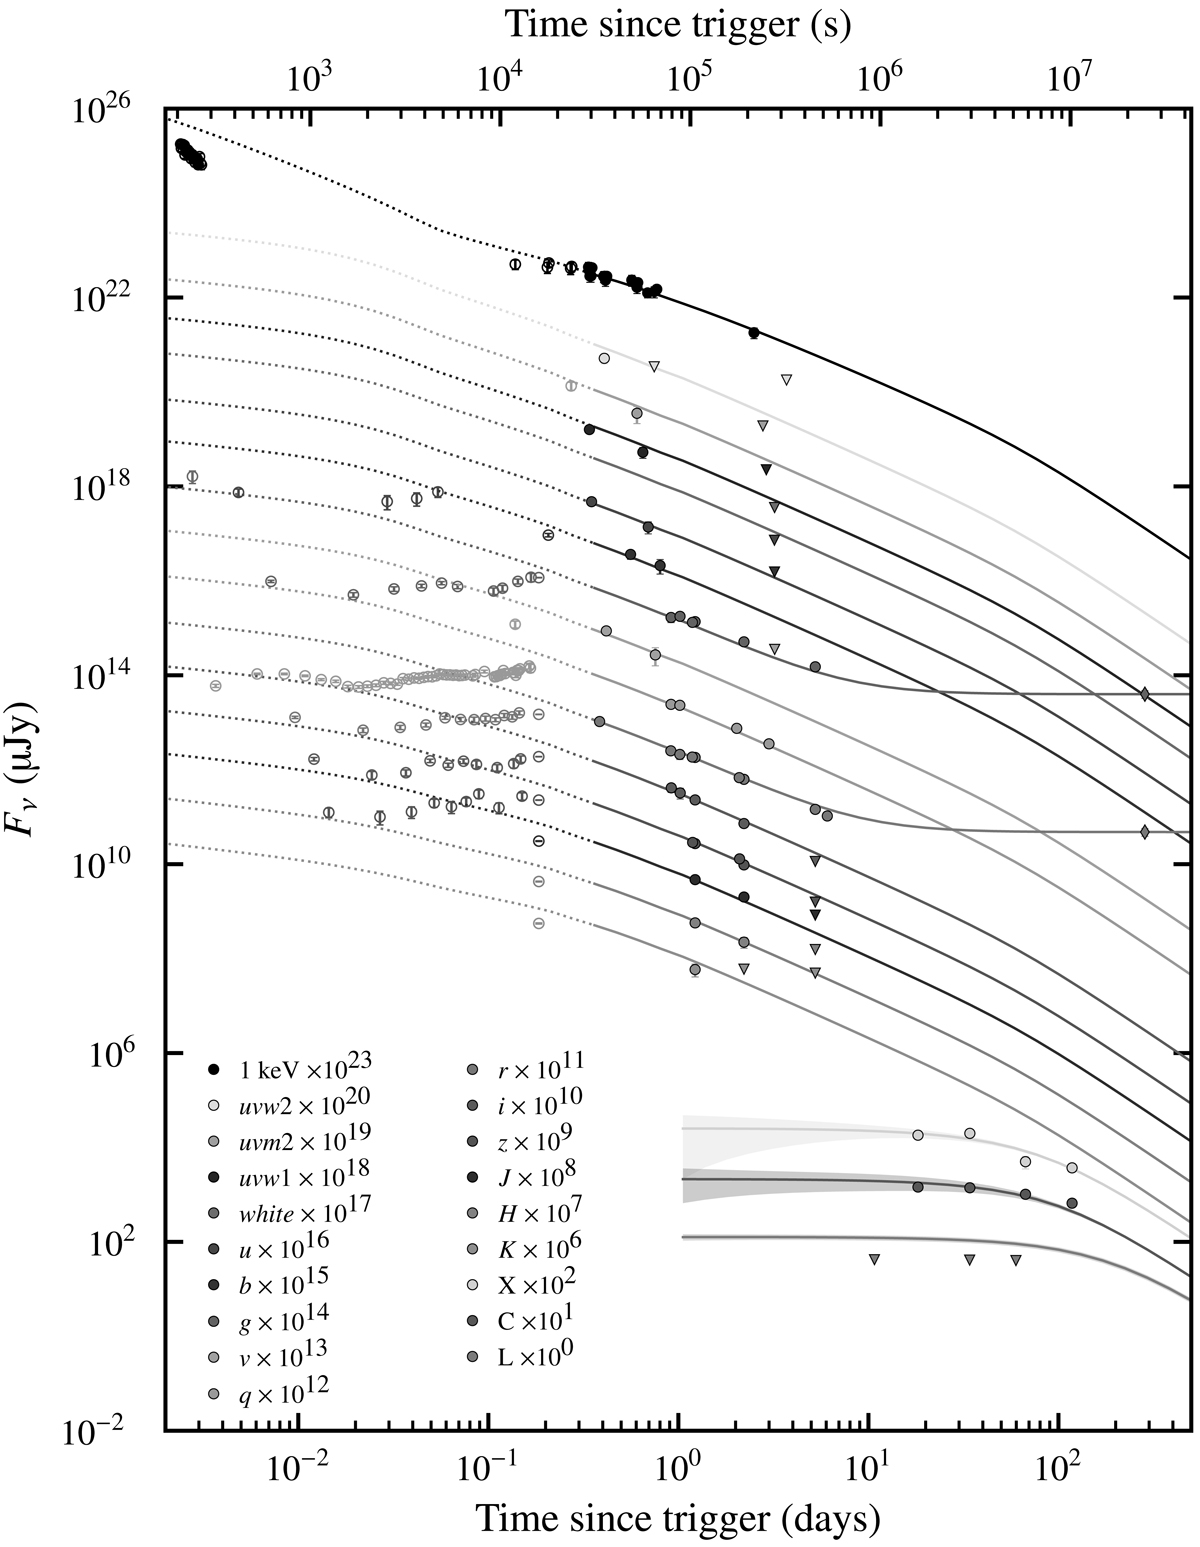
Light curves from our highest-likelihood theoretical model shown for each observing band, spanning X-ray, optical, and radio frequencies. Only data points after 0.3 days were used in the modelling, and we show these as filled-in data points, in contrast to the earlier time data points shown as empty circles. Upper limits are shown as upside-down triangles. The shaded regions surrounding the three radio bands (X, C, and L) represent the effects of Galactic scintillation at the 1σ level. The optical g- and r-band model fits plateau towards the measured host-galaxy flux levels at 285 days, shown as diamonds.
Current usage metrics show cumulative count of Article Views (full-text article views including HTML views, PDF and ePub downloads, according to the available data) and Abstracts Views on Vision4Press platform.
Data correspond to usage on the plateform after 2015. The current usage metrics is available 48-96 hours after online publication and is updated daily on week days.
Initial download of the metrics may take a while.