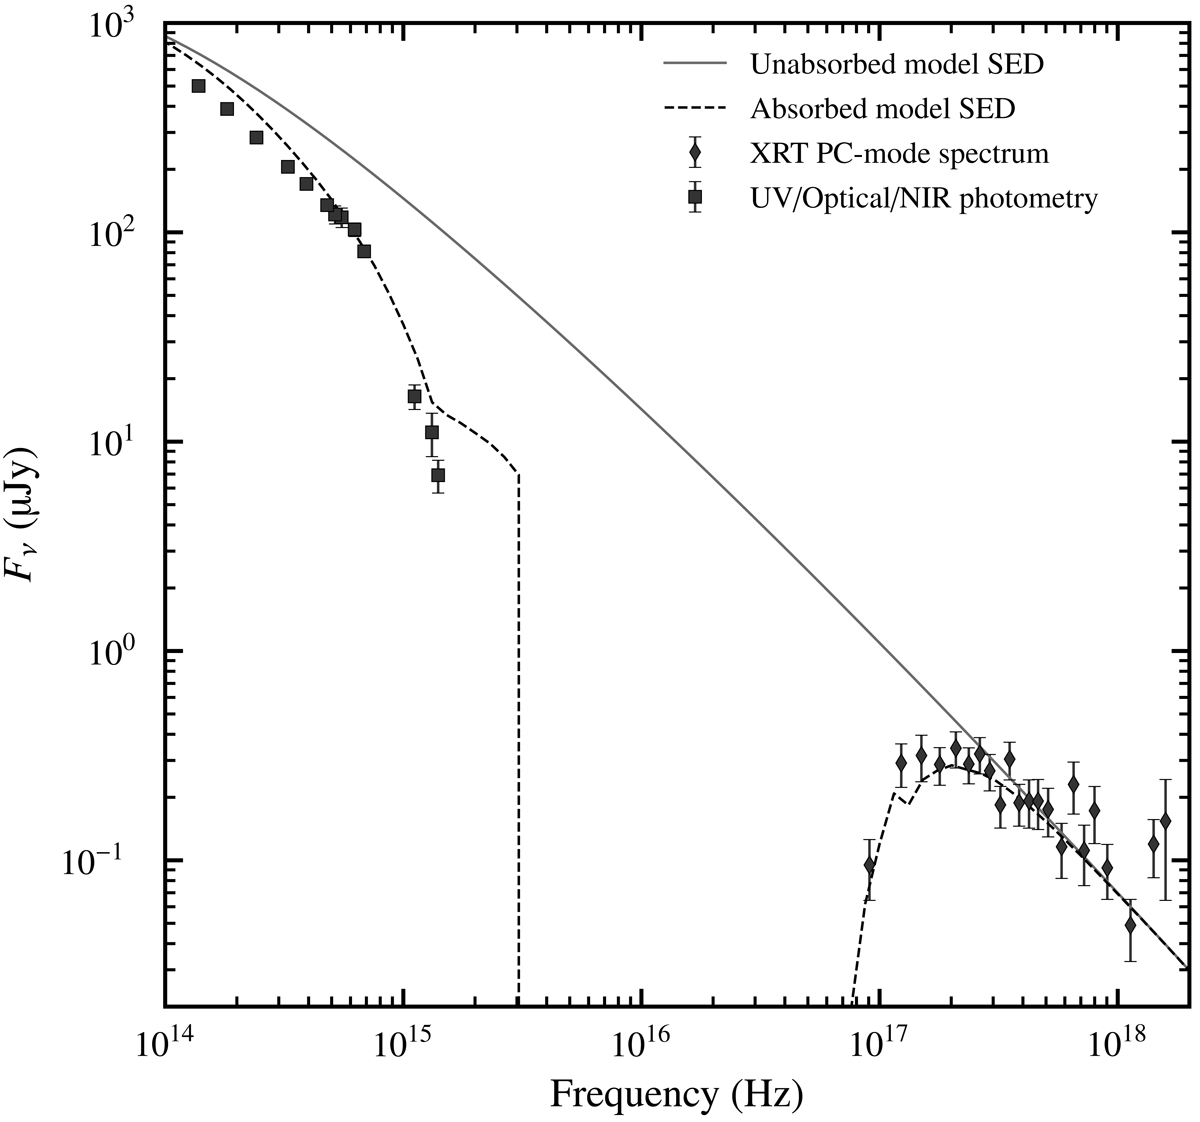
Fig. 5.
Download original image
Optical to X-ray SED at 0.3 days along with the highest-likelihood theoretical model SED, both absorbed (dashed line) and unabsorbed (solid line). The optical photometric data points were derived from the light curve fits to each observing band (see Fig. 4) through interpolating each fit to 0.3 days. The X-ray PC-mode spectrum had a mean photon arrival time of 0.43 days, so we used the X-ray BPL light curve fit in Fig. 2 to determine a correcting factor to shift the spectrum to the expected flux level at 0.3 days.
Current usage metrics show cumulative count of Article Views (full-text article views including HTML views, PDF and ePub downloads, according to the available data) and Abstracts Views on Vision4Press platform.
Data correspond to usage on the plateform after 2015. The current usage metrics is available 48-96 hours after online publication and is updated daily on week days.
Initial download of the metrics may take a while.