Open Access
Fig. 4.
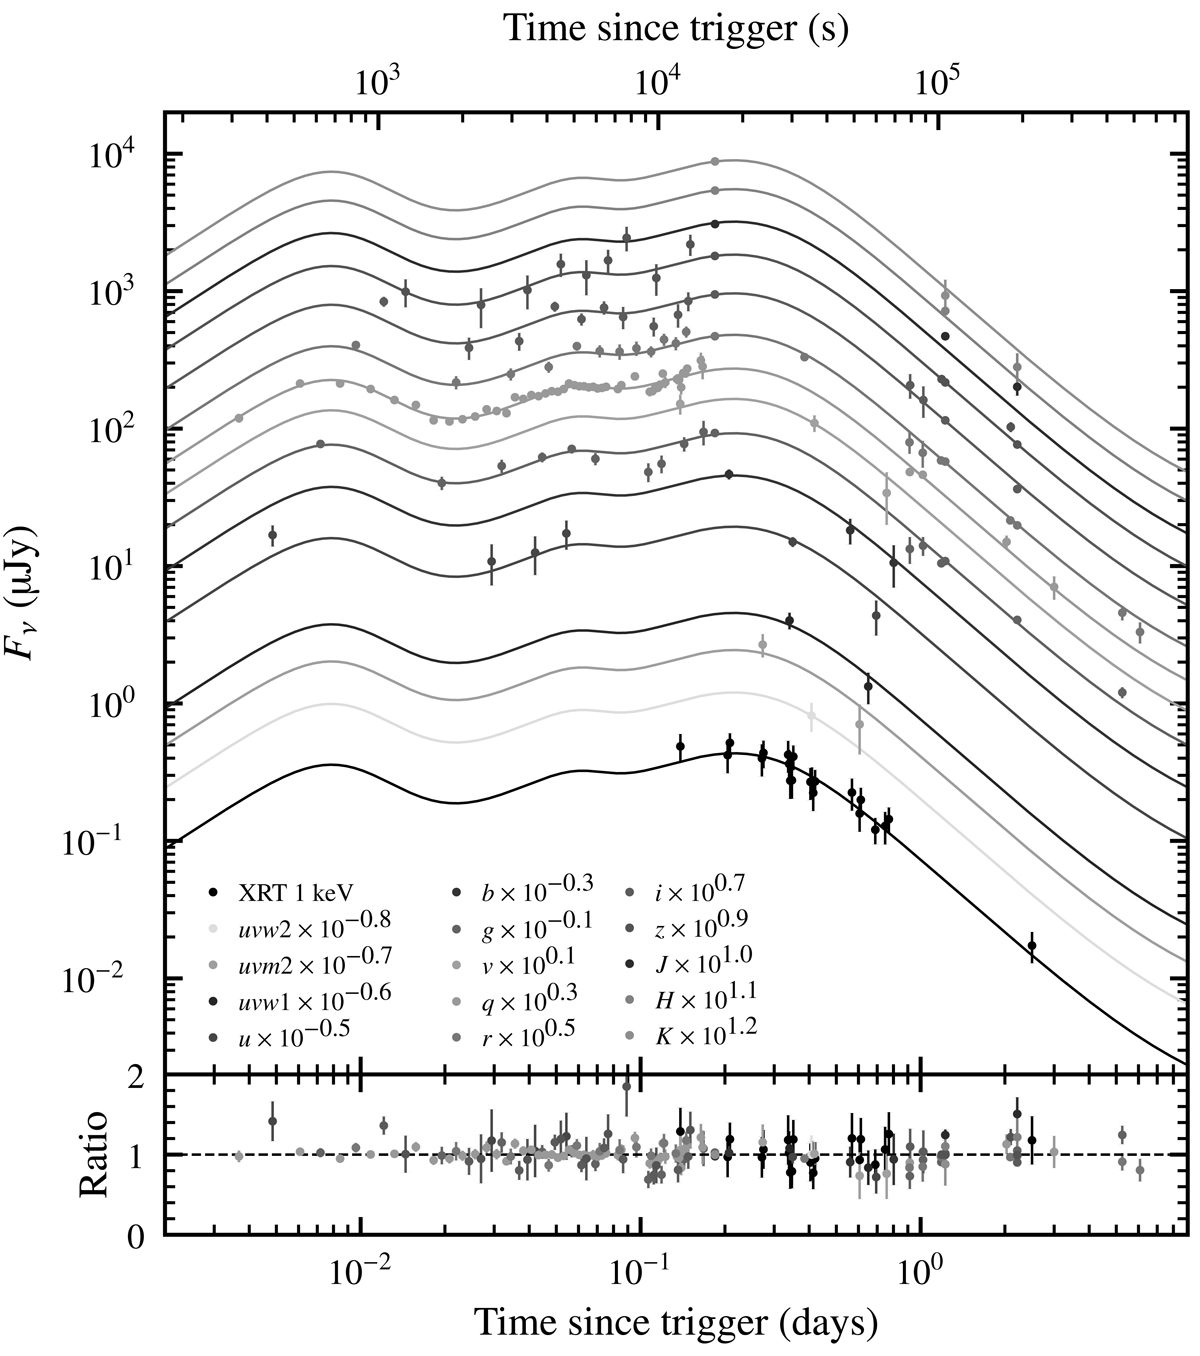
Download original image
Fits to the data in each optical band using the best-fit model to the composite R-band light curve in Fig. 2. We also fitted this model to the X-ray PC-mode data. The lower panel presents the ratio of measured flux to model flux.
Current usage metrics show cumulative count of Article Views (full-text article views including HTML views, PDF and ePub downloads, according to the available data) and Abstracts Views on Vision4Press platform.
Data correspond to usage on the plateform after 2015. The current usage metrics is available 48-96 hours after online publication and is updated daily on week days.
Initial download of the metrics may take a while.