Fig. 2.
Download original image
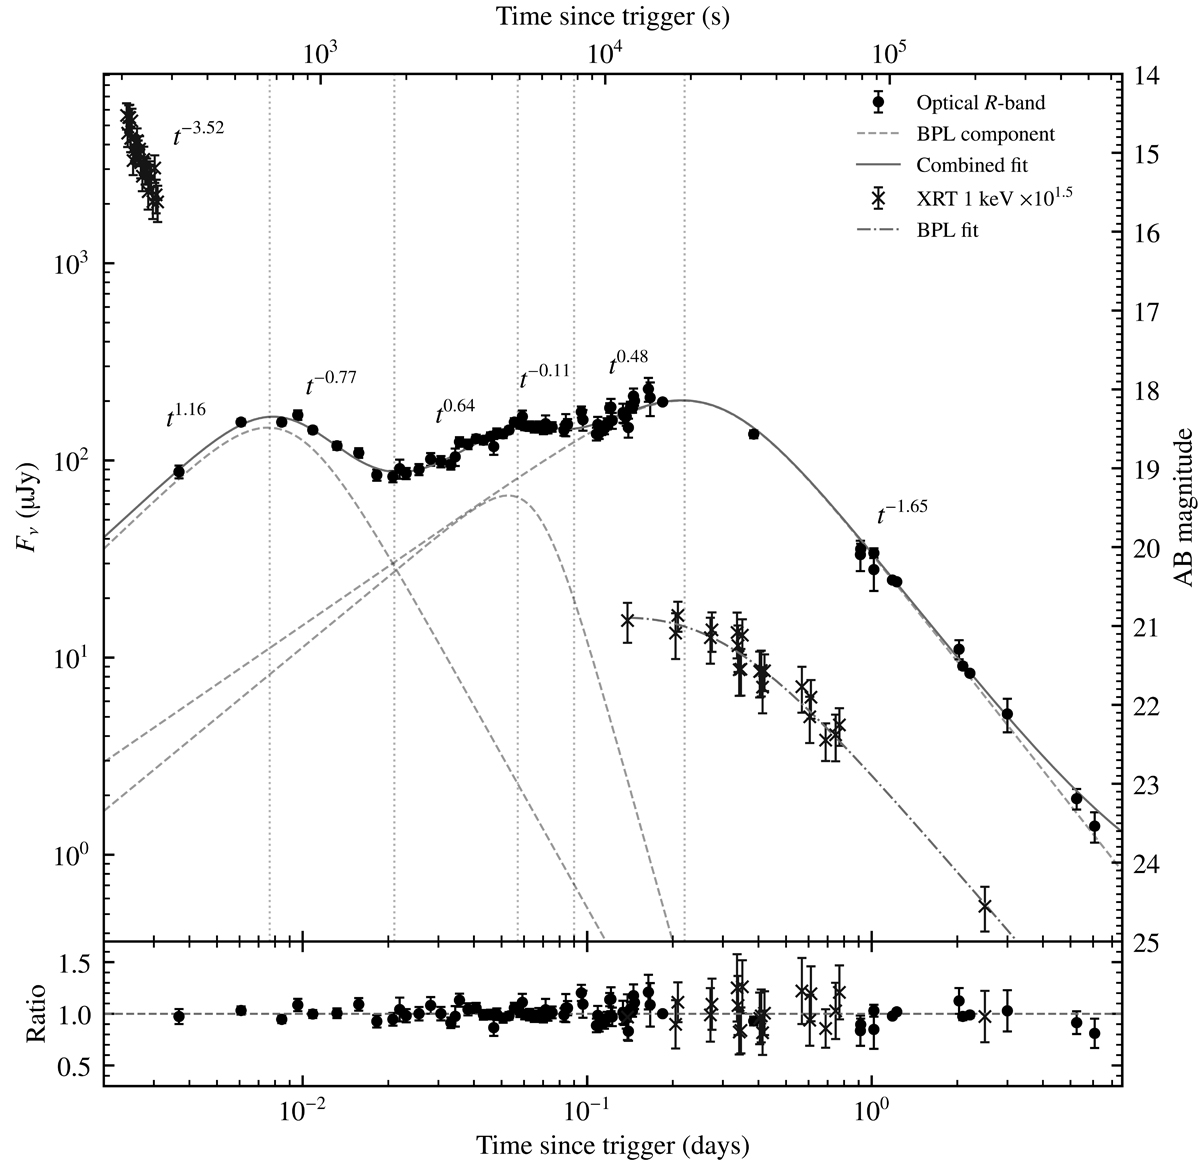
Composite R-band light curve and X-ray 1 keV light curve for GRB 210731A. For each rising and decaying segment of the optical light curve, we show the power-law slope (tα) as an indicator of the steepness of the light curve between each pair of adjacent vertical dotted lines. We also show the fit comprising the sum of three BPL components and a constant term equal to the r′-band host galaxy flux measured by GROND at 285 days (solid red line), along with each individual BPL component (dashed blue lines). For the X-ray light curve, we indicate the steepness of the WT-mode segment and we show the BPL fit to the PC-mode data as a dashed-dotted red line. The results of the X-ray and optical fits are presented in Table 1. The ratio of observed flux to fitted flux is shown in the lower panel.
Current usage metrics show cumulative count of Article Views (full-text article views including HTML views, PDF and ePub downloads, according to the available data) and Abstracts Views on Vision4Press platform.
Data correspond to usage on the plateform after 2015. The current usage metrics is available 48-96 hours after online publication and is updated daily on week days.
Initial download of the metrics may take a while.