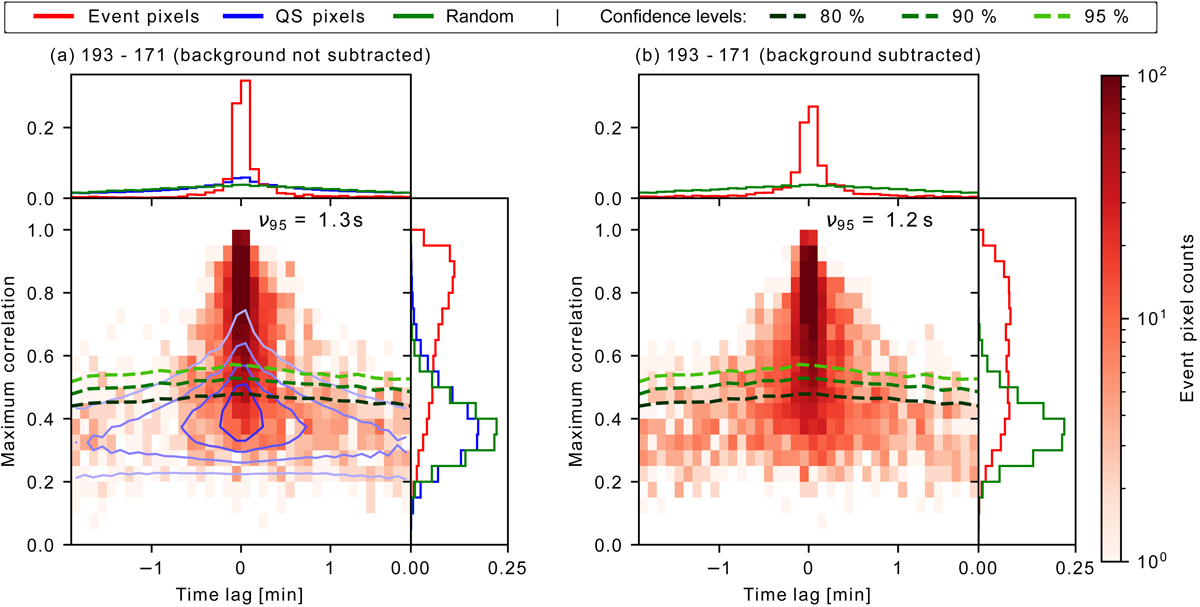
Fig. 7.
Download original image
Margin and 2D histograms of time lags and associated maximum correlation values for couple 193 –171. Subfigure (a) in red shows the original distribution for the event pixels. Subfigure (b) shows the background subtracted event pixels. The blue contours in the central panel of subfigure (a) are the 20, 40, 60, and 80 percentiles of the QS pixel distribution. The green colors in the main panels are the confidence levels, and the distributions of the light curves used to compute them are plotted with the same color in the margin histograms. The margin histograms were normalized by their total number of pixels. The parameter ν> 95 is defined as in Fig. 5.
Current usage metrics show cumulative count of Article Views (full-text article views including HTML views, PDF and ePub downloads, according to the available data) and Abstracts Views on Vision4Press platform.
Data correspond to usage on the plateform after 2015. The current usage metrics is available 48-96 hours after online publication and is updated daily on week days.
Initial download of the metrics may take a while.