Fig. 6.
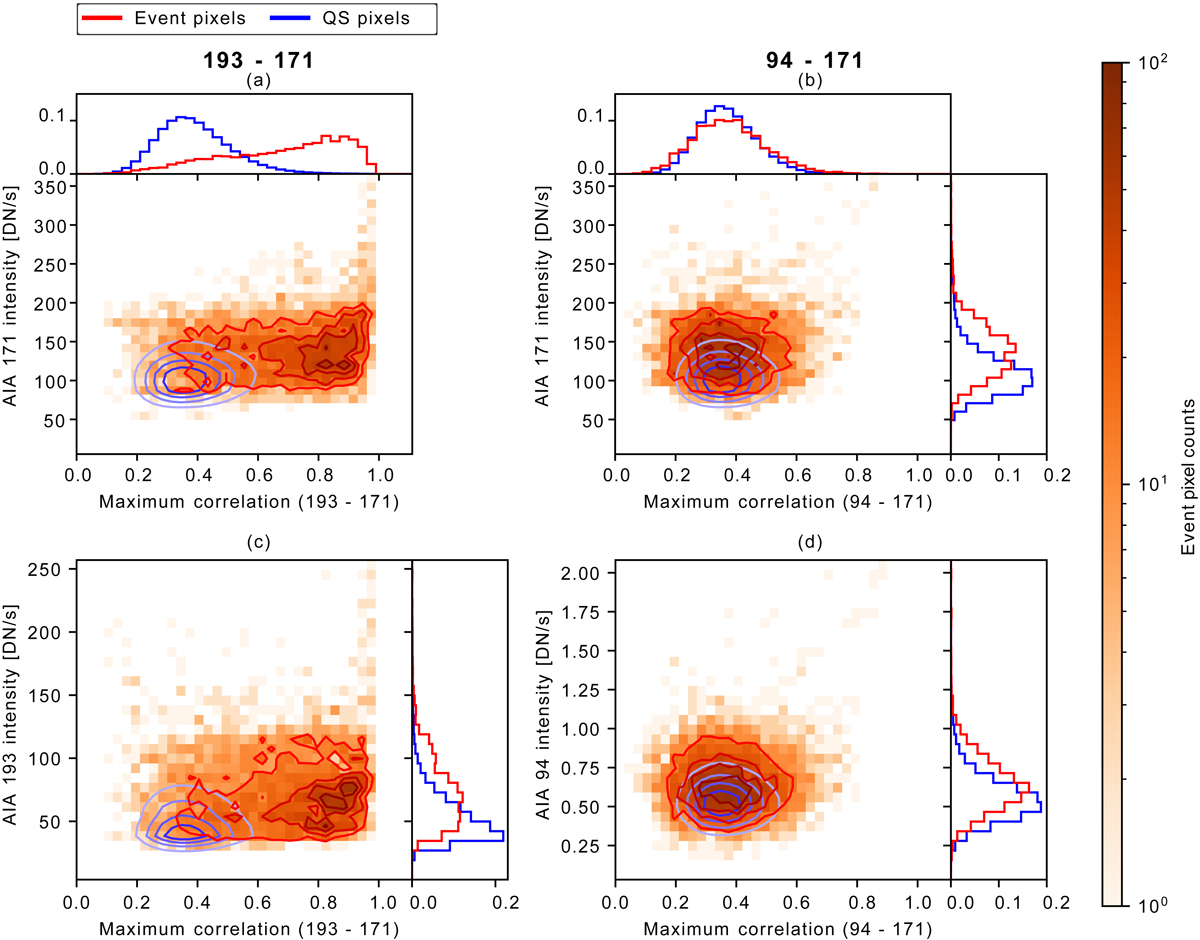
Download original image
Main panels: histograms of the time-averaged intensity, as a function of the maximum cross-correlation, in the whole HRIEUV field of view. The left and right columns show the results for the 193 – 171 and the 94 – 171 couples, respectively. The 2D orange histograms are the counts of event pixels. The 2D red and blue contours correspond to the 20, 40, 60, and 80 percentiles of the events and the QS pixel distributions, respectively. The histograms in the margins were normalized by their total number of counts. No histogram is displayed in the right margin of (a), as it would be a repetition of that of (b). Similarly, the top-margin histograms of (c) and (d) have been omitted, as they are the same as those of (a) and (b), respectively.
Current usage metrics show cumulative count of Article Views (full-text article views including HTML views, PDF and ePub downloads, according to the available data) and Abstracts Views on Vision4Press platform.
Data correspond to usage on the plateform after 2015. The current usage metrics is available 48-96 hours after online publication and is updated daily on week days.
Initial download of the metrics may take a while.