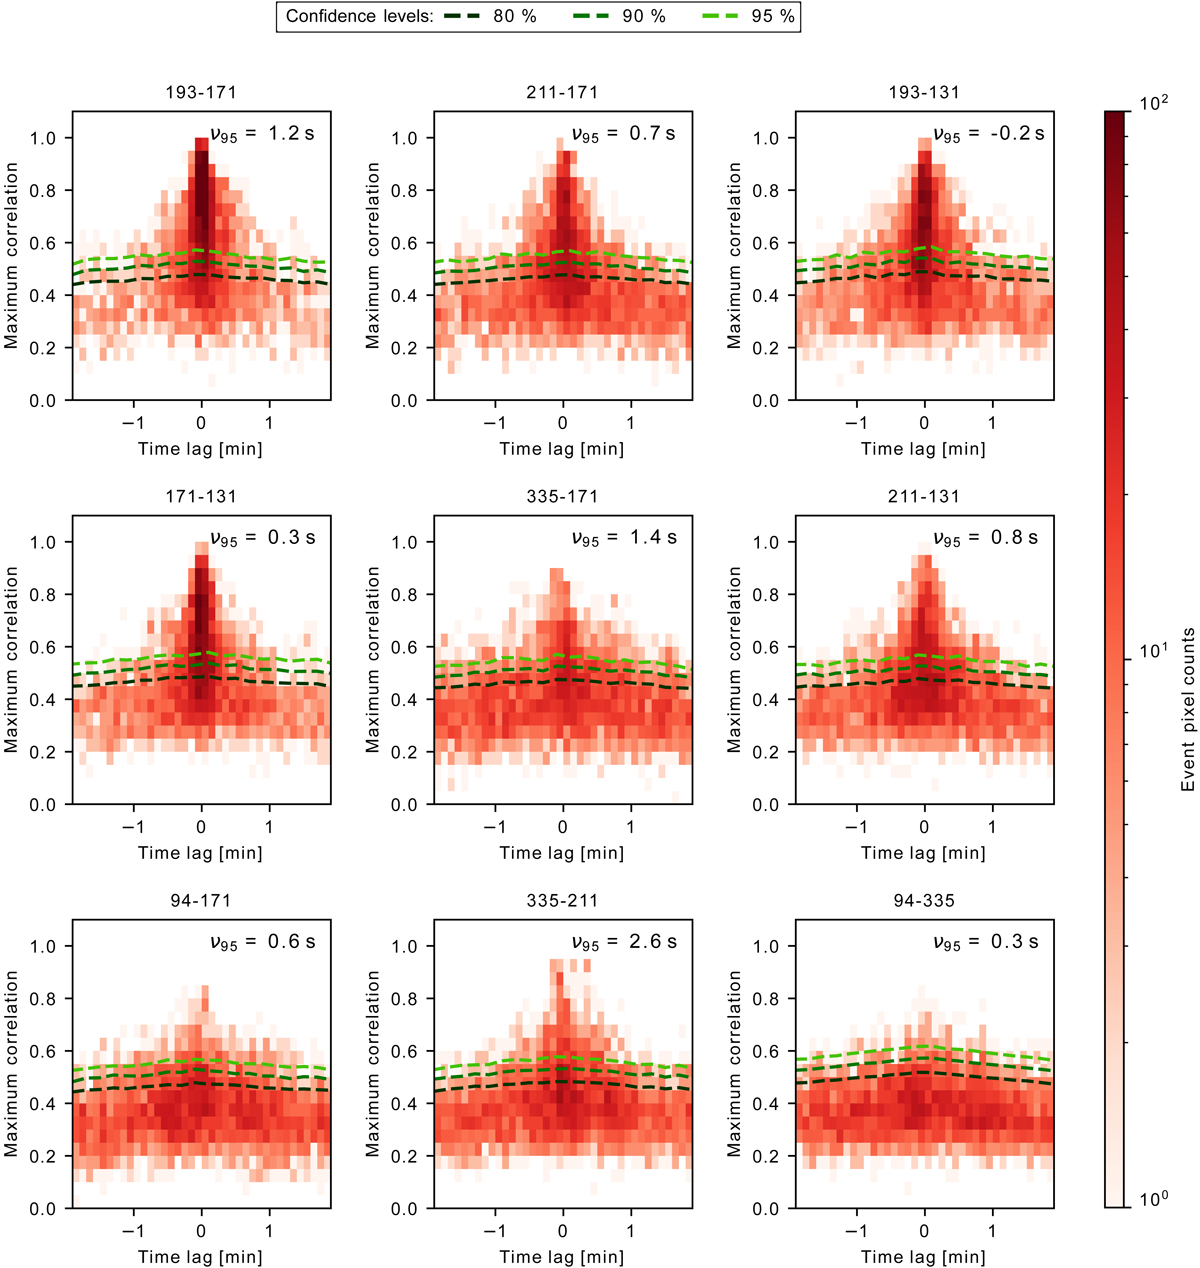
Fig. 5.
Download original image
Two-dimensional histograms (shades of red) of time lags and maximum correlations of nine couples of AIA channels for the 4451 event pixels of the HRIEUV field of view. The estimated background has been subtracted. The green dashed lines are the confidence levels, derived in Appendix A. The ν95 parameter quantifies the asymmetry of the time lag distributions. It represents the average of the event time lags above the 95% confidence level weighted by their respective maximum correlations.
Current usage metrics show cumulative count of Article Views (full-text article views including HTML views, PDF and ePub downloads, according to the available data) and Abstracts Views on Vision4Press platform.
Data correspond to usage on the plateform after 2015. The current usage metrics is available 48-96 hours after online publication and is updated daily on week days.
Initial download of the metrics may take a while.