Fig. 4.
Download original image
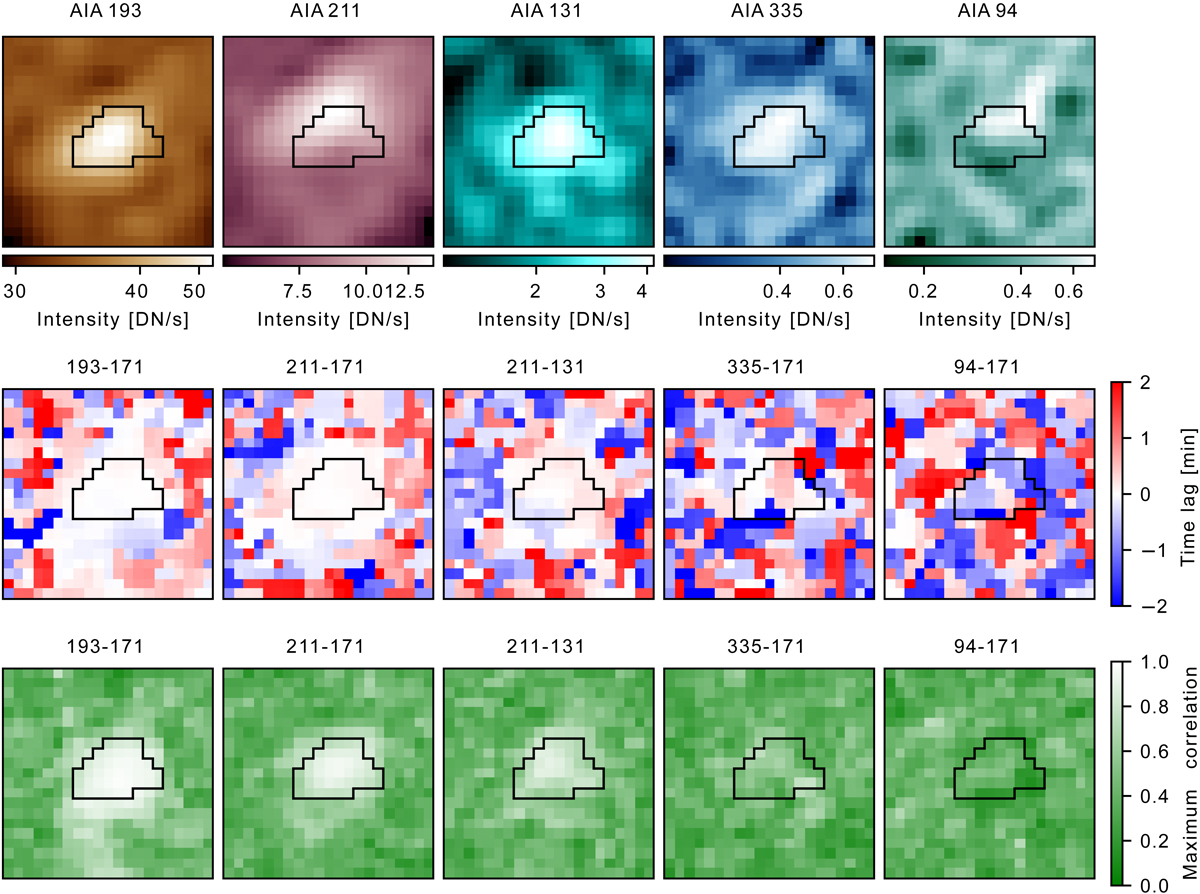
Time extraction procedure applied pixel by pixel to event pixels and their surrounding QS pixels. Top row: intensity maps for five AIA bands (averaged over the temporal sequence) showing the event of Fig. 3a,d. The “event” region is identified by the black contour. Middle and bottom rows: Time lag and associated maximum correlation maps for five couples of AIA bands. These are the result of the pixel-by-pixel cross-correlation analysis. The maximum correlations of the events decreases as the intensities of the involved AIA channels decrease.
Current usage metrics show cumulative count of Article Views (full-text article views including HTML views, PDF and ePub downloads, according to the available data) and Abstracts Views on Vision4Press platform.
Data correspond to usage on the plateform after 2015. The current usage metrics is available 48-96 hours after online publication and is updated daily on week days.
Initial download of the metrics may take a while.