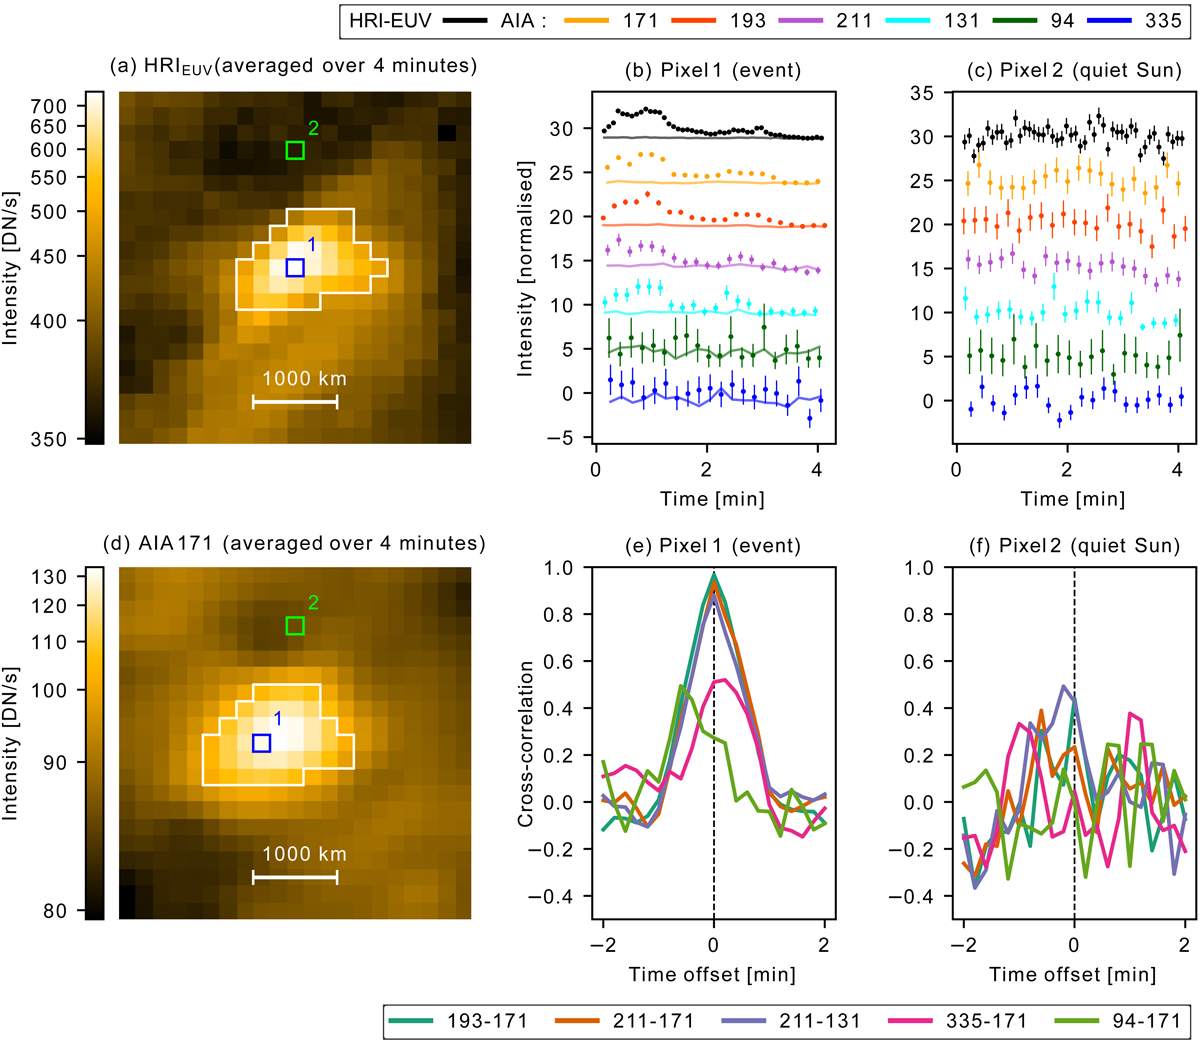
Fig. 3.
Download original image
Illustration of time lag extraction method between AIA channels on event and QS pixels. Images of HRIEUV (a) (14:54:00–14:58:05 UT) and AIA 171 Å (d) (14:57:45–15:01:57 UT) averaged in time over their respective sequence on May 30, 2020. Both images are centered around Carrington coordinates (275.00, 9.07)°. The white contours represent the masks that isolate the event pixels from the QS ones. Pixels 1 and 2 were selected, respectively, as an example for the event pixel and QS pixel. Subfigure (b) shows the light curves in pixel 1 for HRIEUV and the AIA channels original data (dots) and background data estimated with the “inpainting” algorithm (solid curves). For each channel, both curves are normalized over the standard deviation over time of the original data (dots). Subfigure (c) shows the light curves in pixel 2 for the same channels of (b) normalized to their standard deviation over time. Different couples were separated by an arbitrary value of five. The error bars in subfigures (b) and (c) were computed from the shot and read noises. (e) and (f) show the cross-correlation as a function of the time offset between the AIA light curves for pixels 1 (b) and 2 (c), respectively.
Current usage metrics show cumulative count of Article Views (full-text article views including HTML views, PDF and ePub downloads, according to the available data) and Abstracts Views on Vision4Press platform.
Data correspond to usage on the plateform after 2015. The current usage metrics is available 48-96 hours after online publication and is updated daily on week days.
Initial download of the metrics may take a while.