Fig. 1.
Download original image
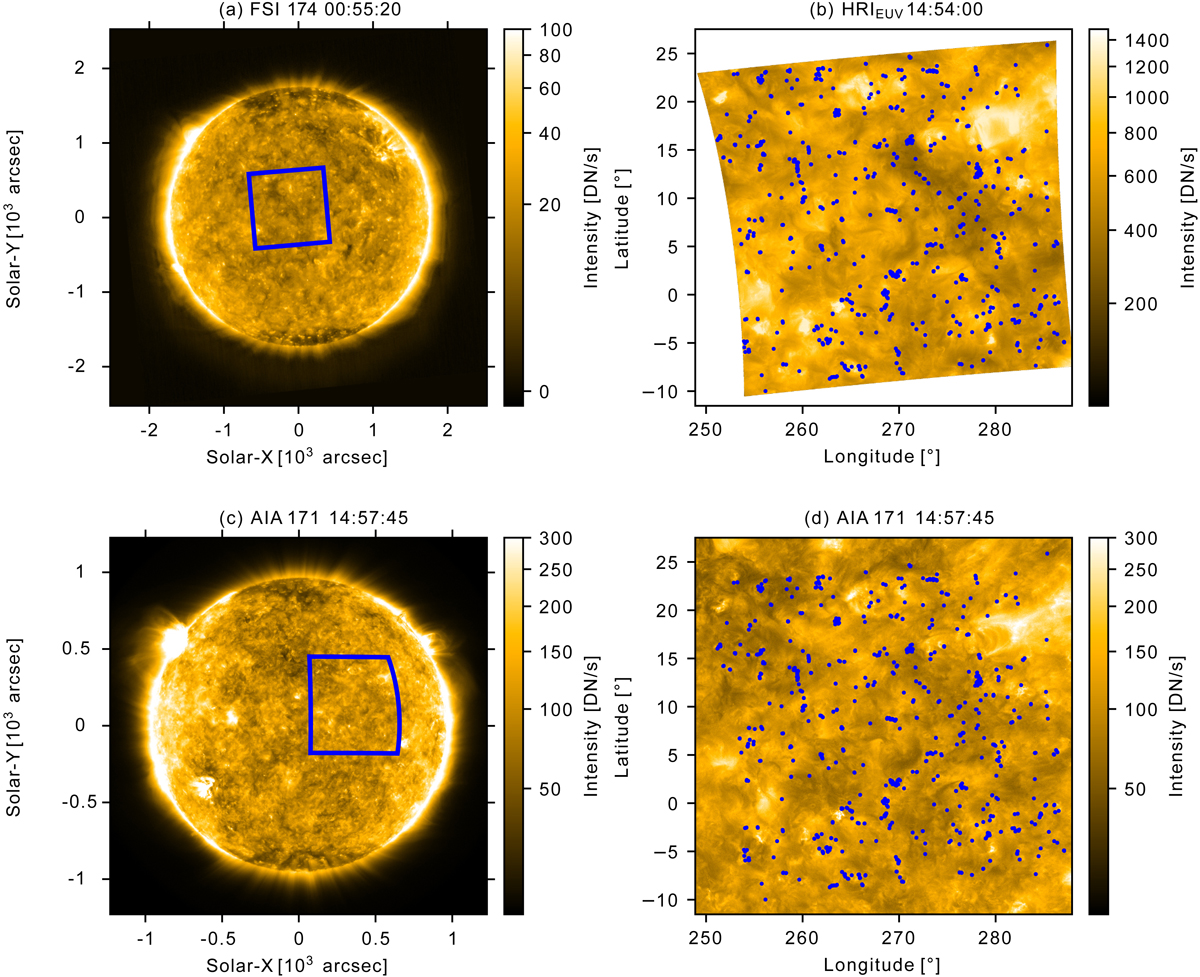
Images captured on May 30, 2020. Upper row: field of view observed by FSI 174 (a) and the first image of the HRIEUV sequence (b) in Carrington coordinates. The FSI image is the closest available to the HRIEUV sequence. Lower row: AIA 171 image (c) and remapped on the same grid as HRIEUV (d). Blue rectangles in the left column correspond to the field of view on the right column, and the blue dots in the right column are the positions of the 1467 detected events.
Current usage metrics show cumulative count of Article Views (full-text article views including HTML views, PDF and ePub downloads, according to the available data) and Abstracts Views on Vision4Press platform.
Data correspond to usage on the plateform after 2015. The current usage metrics is available 48-96 hours after online publication and is updated daily on week days.
Initial download of the metrics may take a while.