Fig. 9
Download original image
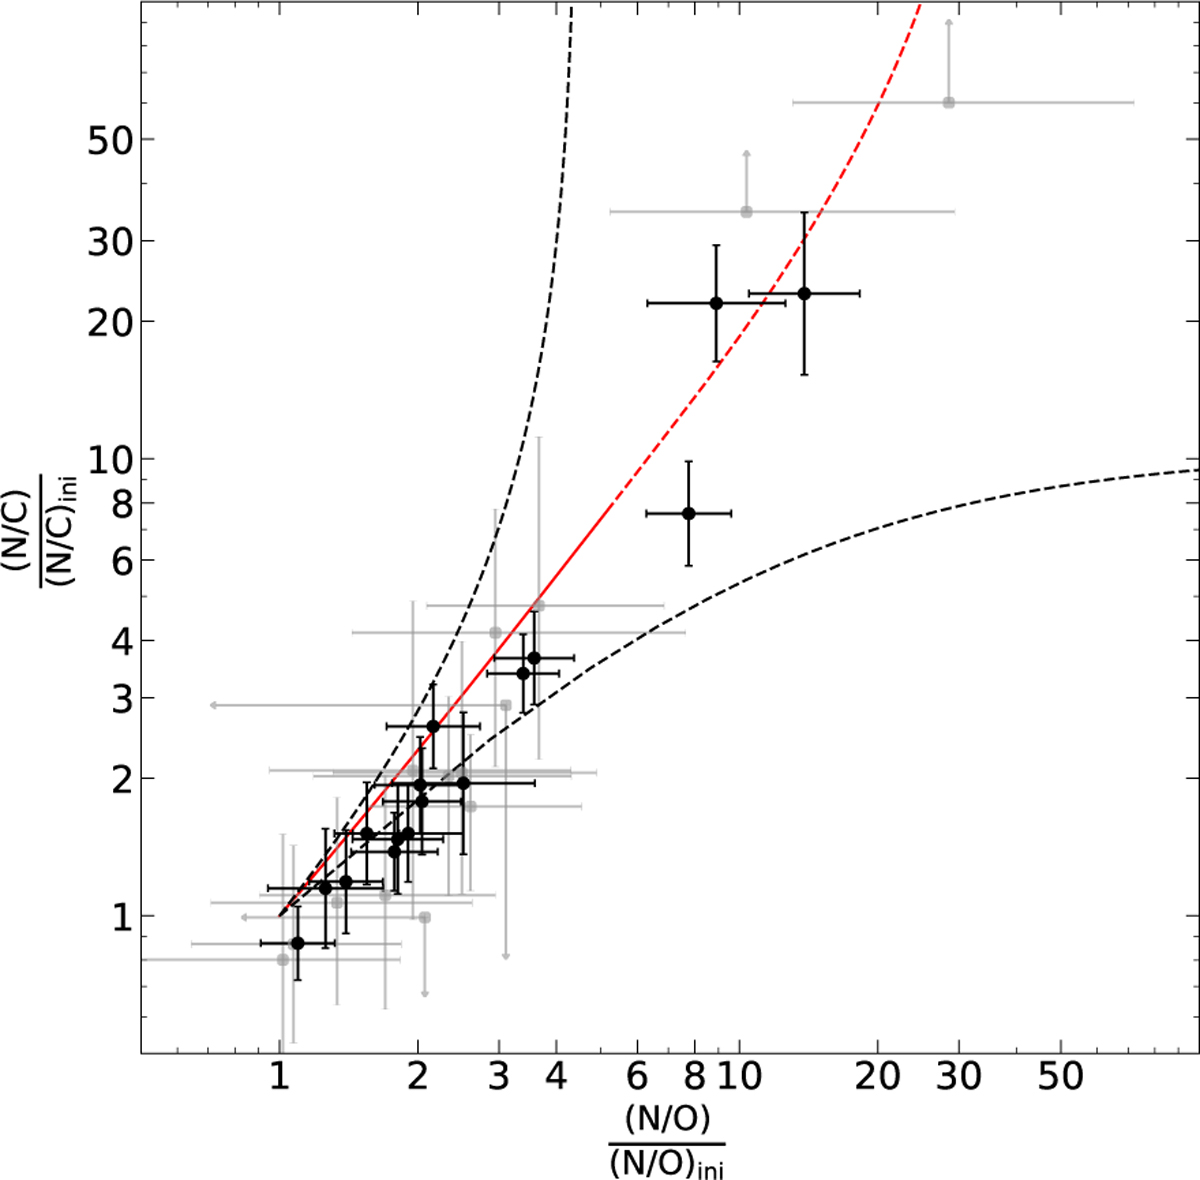
Ratio of the abundance number fraction (N/C) as a function of N/O. The observed abundances (black dots with error bars) are normalised with respect to CAS values and the theoretical data to the solar abundances used for the stellar evolution models. The red line shows a rotating evolutionary model of a 20 M⊙ star (Ekström et al. 2012), which is representative for the mean mass of our sample stars. The transition from solid to dashed indicates the end of the main sequence. The dashed black lines show theoretical bounds for the CN cycle (i.e. assuming oxygen shows a constant abundance, shown with the upward-evolving curve) and for the ON cycle (i.e. assuming carbon to be at equilibrium abundance, shown by the horizontally evolving curve). The same stars from the analyses of Martins et al. (2015a,b) are shown in grey.
Current usage metrics show cumulative count of Article Views (full-text article views including HTML views, PDF and ePub downloads, according to the available data) and Abstracts Views on Vision4Press platform.
Data correspond to usage on the plateform after 2015. The current usage metrics is available 48-96 hours after online publication and is updated daily on week days.
Initial download of the metrics may take a while.