Fig. 8
Download original image
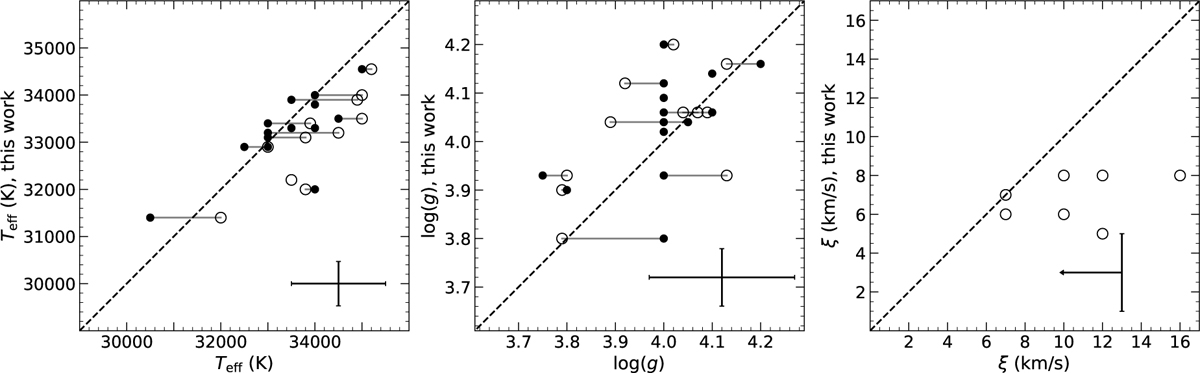
Comparison of our Teff (left), log g-values (middle), and microturbulence (right panel) with data from Martins et al. (2015a,b, dots) and Holgado et al. (2018, 2022, circles). A uniform value of ξ =10 km s−1 was adopted for the photospheric layers of the stars in the Martins et al. (2015a,b) work. Different literature results for the same star are connected by black lines. Typical error bars from the Martins et al. (2015a,b) work are indicated in the left and middle panels; the uncertainties from Holgado et al. are slightly smaller, and for the microturbulent velocities they provide only upper limits in many cases.
Current usage metrics show cumulative count of Article Views (full-text article views including HTML views, PDF and ePub downloads, according to the available data) and Abstracts Views on Vision4Press platform.
Data correspond to usage on the plateform after 2015. The current usage metrics is available 48-96 hours after online publication and is updated daily on week days.
Initial download of the metrics may take a while.