Open Access
Fig. 4
Download original image
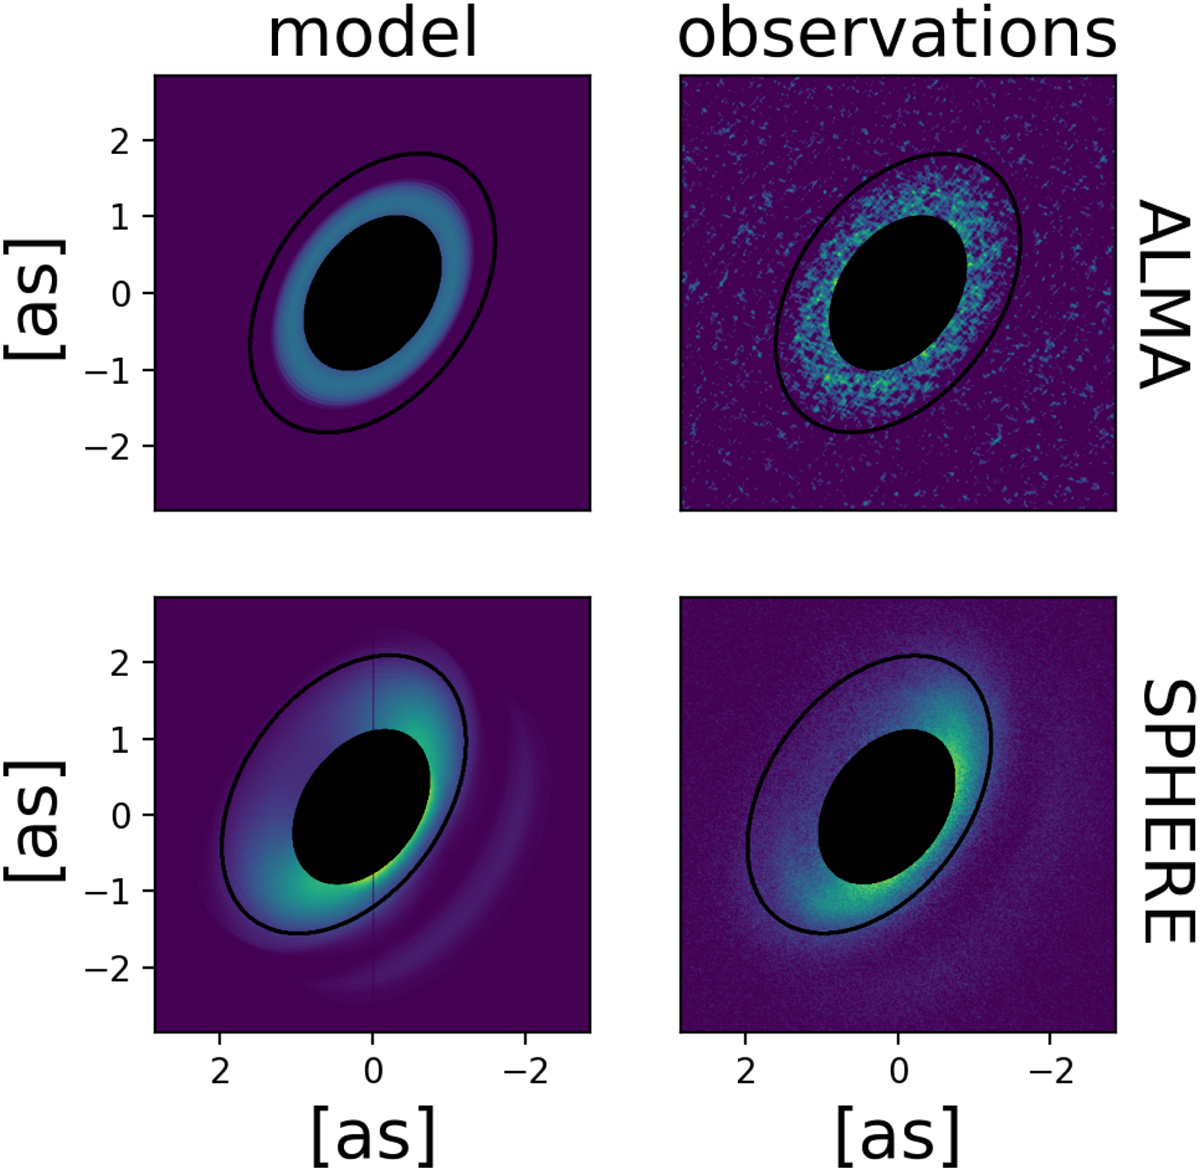
Comparison between the simulated 1.25 mm continuum and 1.65 µm polarized emission, and the ALMA and SPHERE data. The black masks show the region inside 1 arcsec radius, not included in our fitting, where radial structures are observed. The blackcircle is the 2.5 arcsec radius, the outer edge of the disk.
Current usage metrics show cumulative count of Article Views (full-text article views including HTML views, PDF and ePub downloads, according to the available data) and Abstracts Views on Vision4Press platform.
Data correspond to usage on the plateform after 2015. The current usage metrics is available 48-96 hours after online publication and is updated daily on week days.
Initial download of the metrics may take a while.