Fig. 9
Download original image
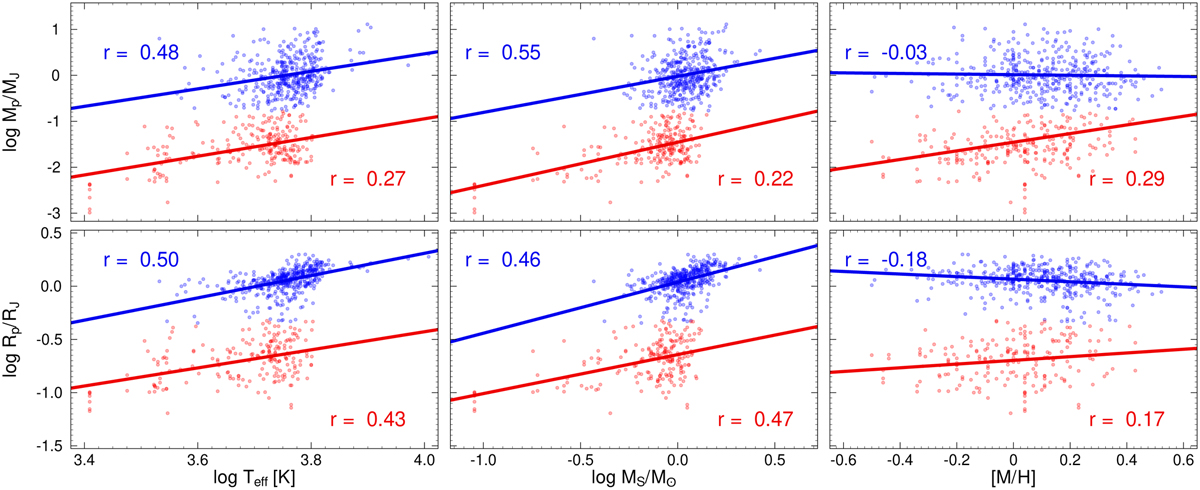
Correlation between planet mass (top row), planetary radius (bottom row), and the main stellar parameters: Teff (left column), MS (middle column), and [M/H] (right column). The samples are divided into two groups via a fuzzy clustering algorithm applied to the distributions in the right panels. Blue points: Cluster of “larger planets.” Red points: Cluster of ‘smaller planets.” The fitted linear trends of Eqs. (2)–(11) are plotted with solid blue and red lines. Pearson’s r values, corresponding to the giant and smaller exoplanets are also displayed with blue and red, respectively.
Current usage metrics show cumulative count of Article Views (full-text article views including HTML views, PDF and ePub downloads, according to the available data) and Abstracts Views on Vision4Press platform.
Data correspond to usage on the plateform after 2015. The current usage metrics is available 48-96 hours after online publication and is updated daily on week days.
Initial download of the metrics may take a while.