Open Access
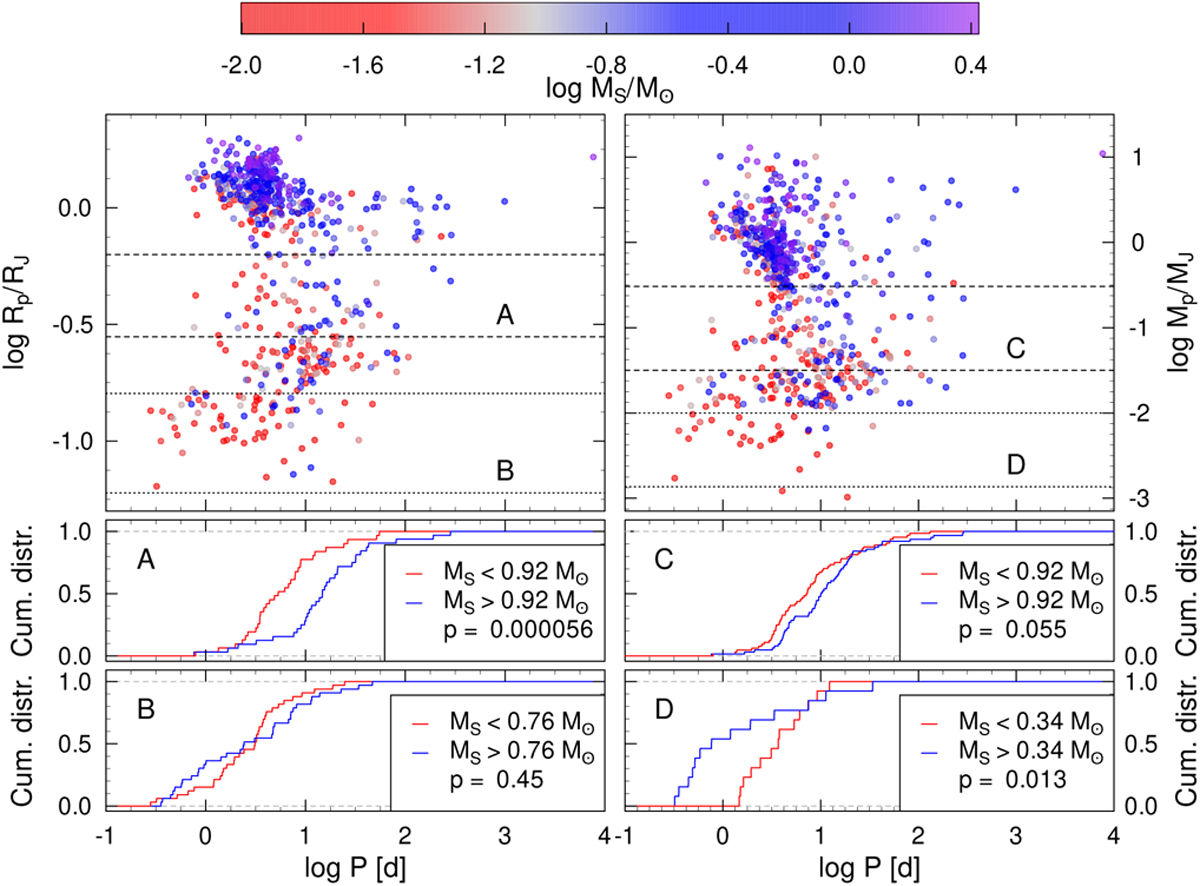
Fig. 6
Download original image
Scatterplots showing the distribution of exoplanets in the RP–P and MP–P parameter spaces with MS used as the third parameter (top row) and the respective cumulative distributions (middle and bottom rows; same as Fig. 4).
Current usage metrics show cumulative count of Article Views (full-text article views including HTML views, PDF and ePub downloads, according to the available data) and Abstracts Views on Vision4Press platform.
Data correspond to usage on the plateform after 2015. The current usage metrics is available 48-96 hours after online publication and is updated daily on week days.
Initial download of the metrics may take a while.