Fig. 4
Download original image
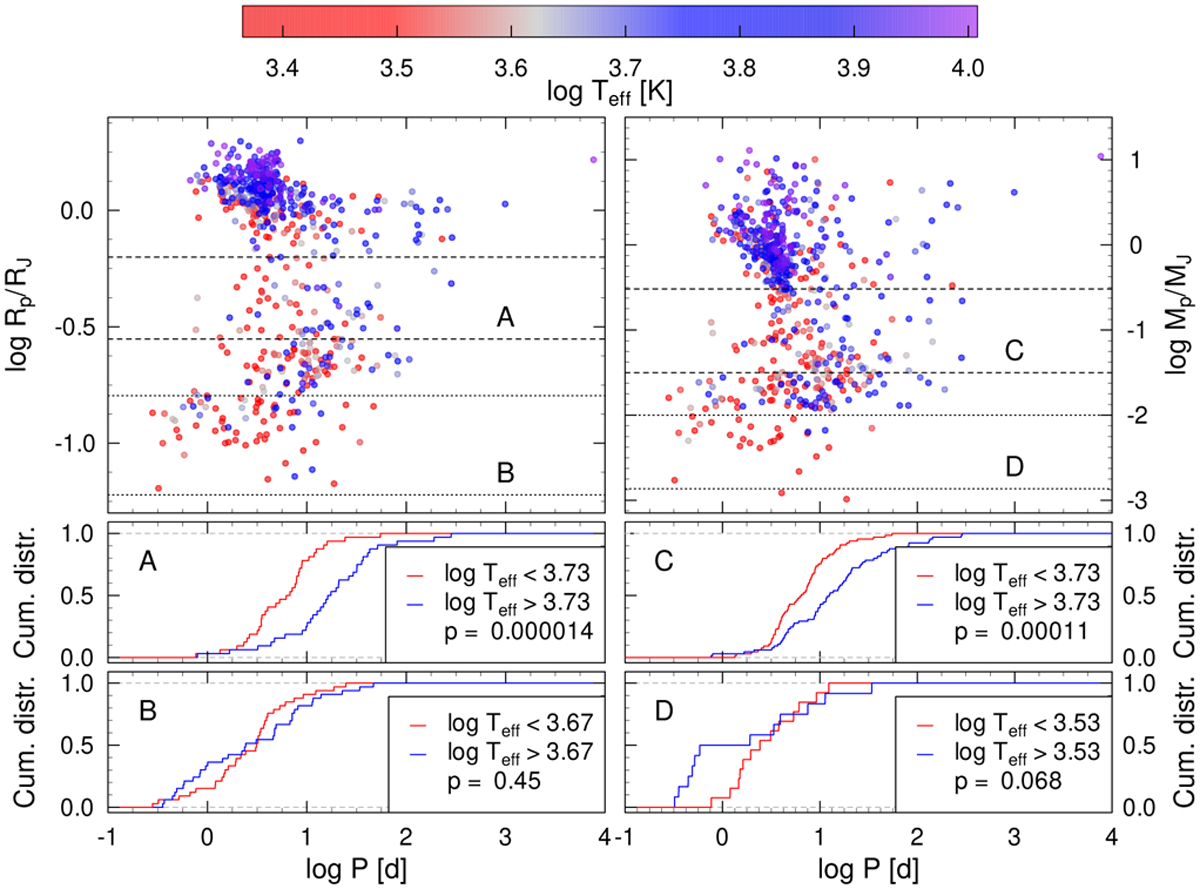
Scatterplot showing the distribution of exoplanets in the RP–P (top left) and MP–P (top right) parameter spaces, colored by the temperature of the host star (see the color bar for the values). The middle and bottom panels show the cumulative distribution of the two samples divided at the median of Teff in the A, B, C, and D regions. The p-values of the KS-test are also shown.
Current usage metrics show cumulative count of Article Views (full-text article views including HTML views, PDF and ePub downloads, according to the available data) and Abstracts Views on Vision4Press platform.
Data correspond to usage on the plateform after 2015. The current usage metrics is available 48-96 hours after online publication and is updated daily on week days.
Initial download of the metrics may take a while.