Fig. 9
Download original image
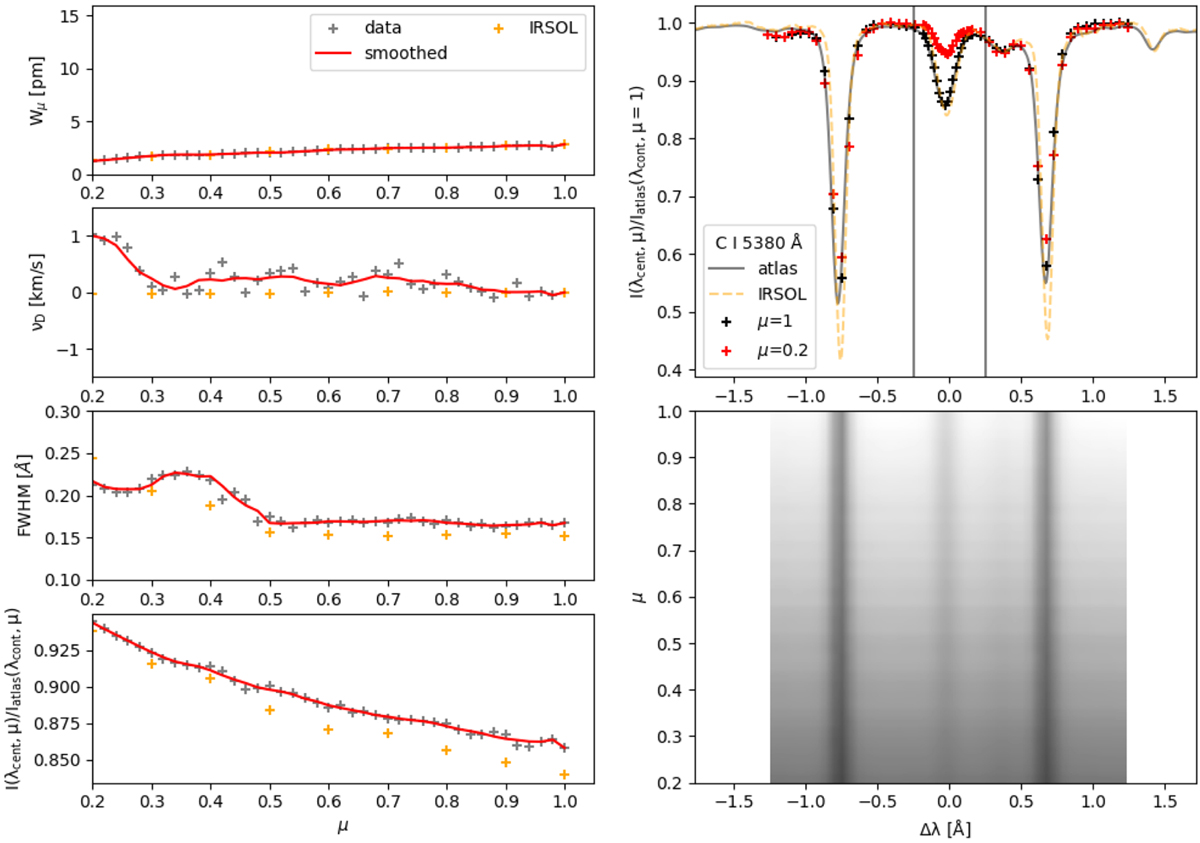
Summary of the CLV data of the C I 5380 Aline. Left: four panels showing the equivalent width, line shift, FWHM, and line depth, respectively. Right: representative profiles of C I 5380 Å. In the upper panel, we plot a convolved profile from the solar atlas as well as our data at μ = 1 and μ = 0.2. The pair of black lines show the range over which the equivalent width has been calculated. The lower panel shows a 2D representation of all 50 profiles.
Current usage metrics show cumulative count of Article Views (full-text article views including HTML views, PDF and ePub downloads, according to the available data) and Abstracts Views on Vision4Press platform.
Data correspond to usage on the plateform after 2015. The current usage metrics is available 48-96 hours after online publication and is updated daily on week days.
Initial download of the metrics may take a while.