Fig. 8
Download original image
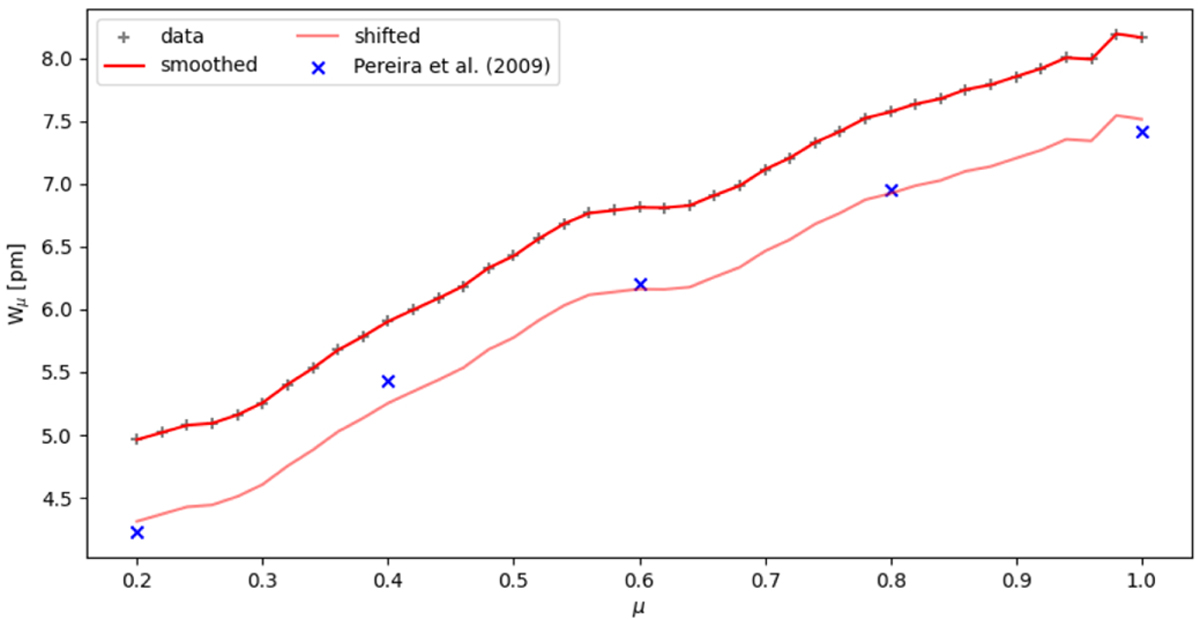
Enlarged version of the first panel of Fig. 12 showing the equivalent width of the O I 7772 Å line as a function of μ compared with measured values by Pereira et al. (2009). We plot the data (gray), the smoothed data (red), the measurements of Pereira et al. (2009) (blue), and our smoothed data shifted down to match the disk center observation of the blue points in light red. The latter was added to ease comparison in regards to the gradient between the two data sets.
Current usage metrics show cumulative count of Article Views (full-text article views including HTML views, PDF and ePub downloads, according to the available data) and Abstracts Views on Vision4Press platform.
Data correspond to usage on the plateform after 2015. The current usage metrics is available 48-96 hours after online publication and is updated daily on week days.
Initial download of the metrics may take a while.