Fig. 9.
Download original image
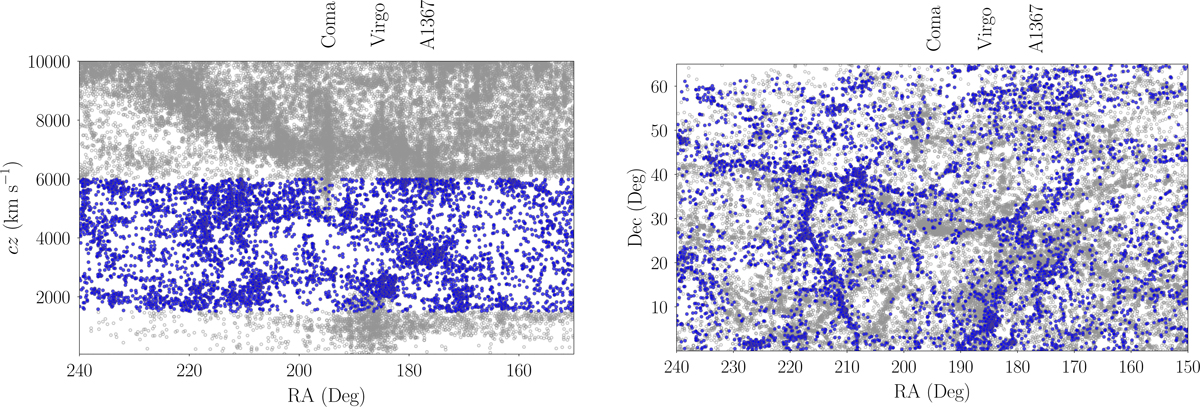
Selection criterion discussed in Sect. 2.4 used to identify the SR. Left: Distribution of the Hubble velocity cz as a function of RA. Blue dots indicate galaxies with 1500 < cz/km s−1< 6000, (with the exclusion of objects belonging to the fingers of God of either Coma or Virgo). Right: Sky distribution of galaxies in the 1500 < cz/km s−1 < 6000 range highlighting a filamentary structure that we dub the SR.
Current usage metrics show cumulative count of Article Views (full-text article views including HTML views, PDF and ePub downloads, according to the available data) and Abstracts Views on Vision4Press platform.
Data correspond to usage on the plateform after 2015. The current usage metrics is available 48-96 hours after online publication and is updated daily on week days.
Initial download of the metrics may take a while.